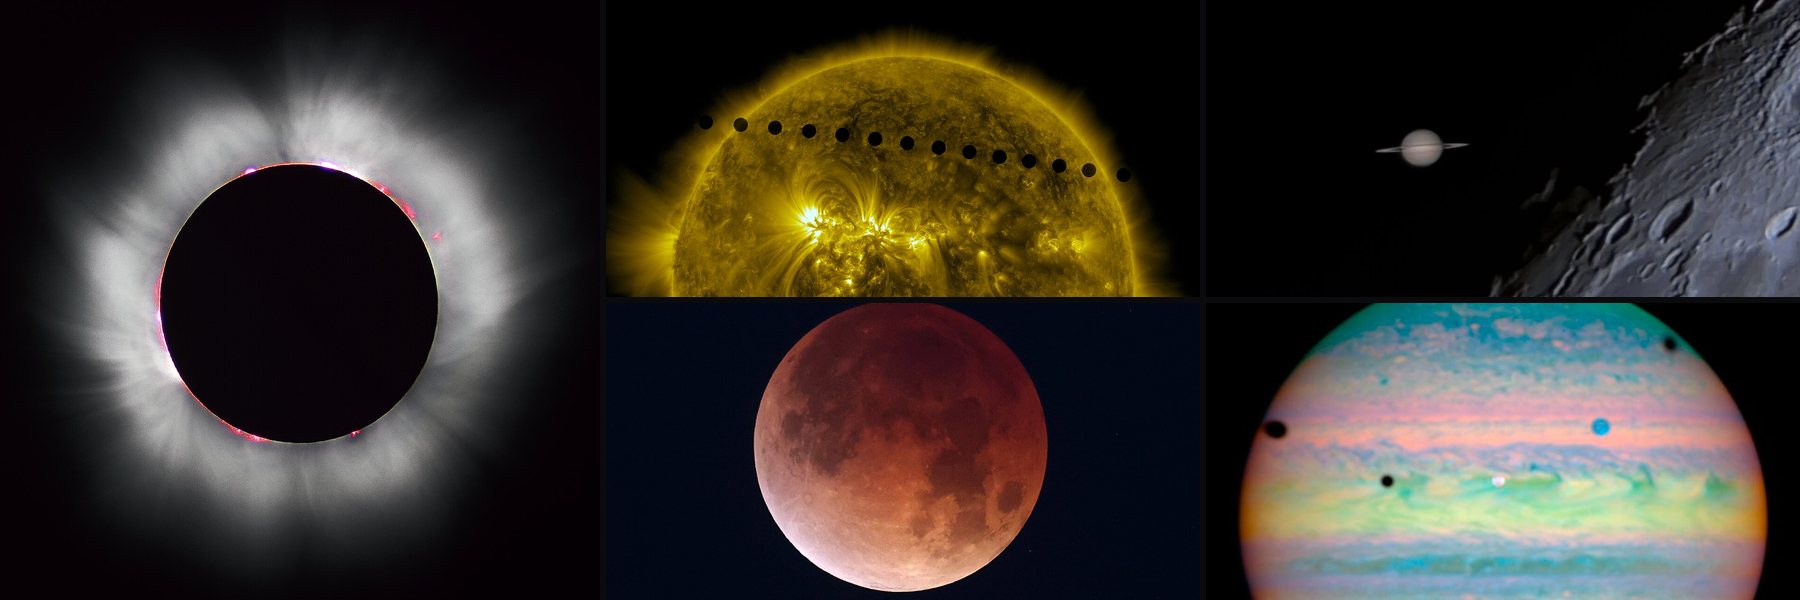
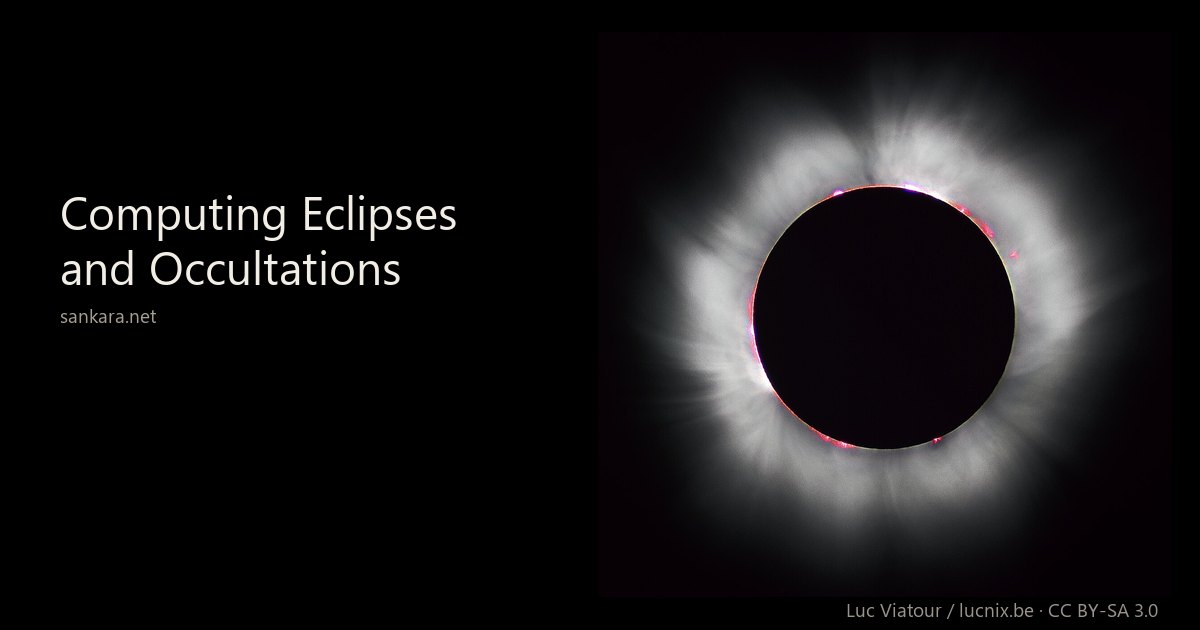
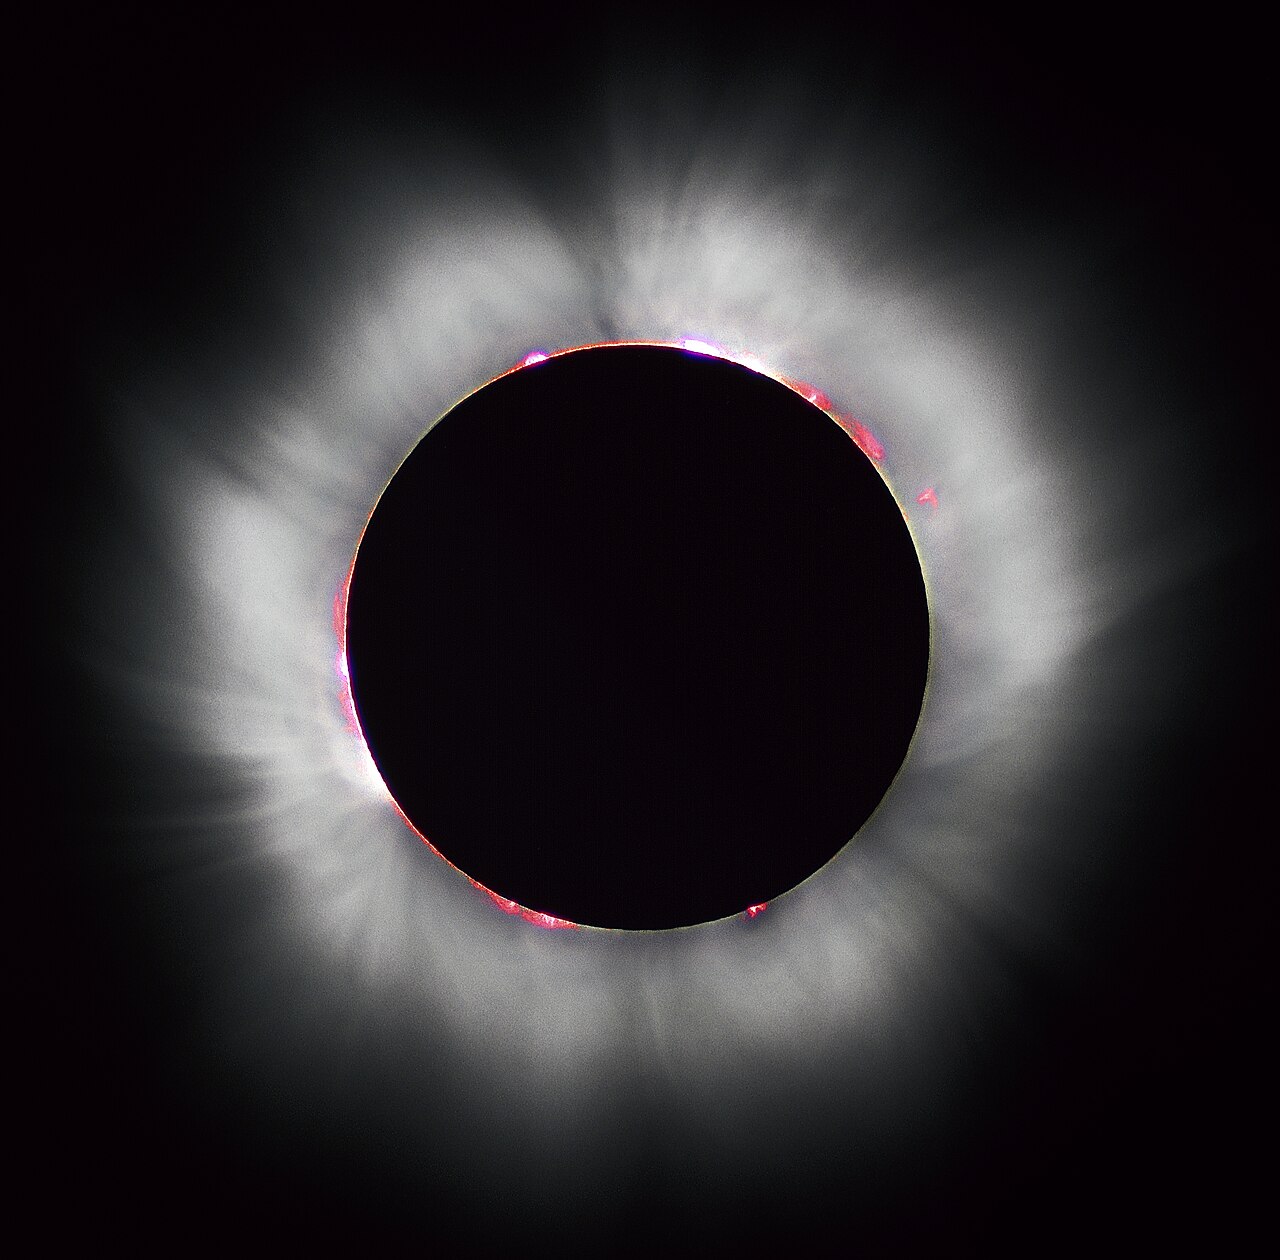
Home page collage
The two cases of one shadow geometry. Left: a total solar eclipse,
1999 August 11, by Luc Viatour / lucnix.be ,
CC BY-SA 3.0. Top centre: the transit of Venus, 2012 June 5-6, by
NASA/Goddard Space Flight Center/SDO, public domain. Top right: Saturn just
before the Moon occults it, 2024 August 21, by Sebas FL, CC BY-SA 4.0. These
three are the hidden case, where the observer stands in the shadow. Bottom
centre: a total lunar eclipse, 2026 March 3, by NASA/Michael DeMocker,
public domain. Bottom right: the shadows of Io, Ganymede and Callisto on
Jupiter, 2004 March 28, by
NASA, ESA, and E. Karkoschka (University of Arizona), public domain. These
two are the darkened case, where another body stands in the shadow. The
collage is published under CC BY-SA 4.0.
Read more photograph · Computing Eclipses and Occultations · Third-party, CC BY-SA 4.0, shared alike. Source
Hidden: the observer stands in the Moon's shadow in starlight Left, a star, labelled light source, sending parallel lines of light to the right. Middle, the Moon, labelled blocking body. The lines that meet the Moon stop there, and a pale band behind the Moon marks where the star cannot be seen. Lines above and below the Moon carry on. Right, an observer on the Earth, labelled observer, inside the band. Schematic, not to scale Light source a star Blocking body the Moon Observer on the Earth the Moon's shadow in starlight Hidden case: a star occultation
In a lunar occultation of a star the observer stands in the Moon's shadow in starlight, so the star is hidden. Observers outside that band see nothing happen.
Read more diagram; 3D view on its page · How eclipses, occultations and transits are computed · Drawn here, tools/figures/prim_case_hidden.py
Hidden: the observer stands in the Moon's umbra and the Sun is hidden Left, the Sun, labelled light source. Middle, the Moon, labelled blocking body. Behind the Moon a pale penumbra spreads out and a darker umbra narrows towards the Earth on the right, where both fall on the Earth's surface. An observer, labelled observer, stands inside the umbra on the Earth. A framed panel on the right shows what the observer sees: a total eclipse, the Moon's dark disc covering the Sun with a faint corona fading outwards around it. Schematic, not to scale What the observer sees totality Light source the Sun Blocking body the Moon Observer on the Earth in the Moon's umbra umbra Totality in the Moon's umbra
In a solar eclipse the observer stands in the Moon's umbra, so the Moon hides the whole Sun: being in the shadow and seeing the Sun hidden are one event.
Read more diagram · How eclipses, occultations and transits are computed · Drawn here, tools/figures/prim_example_solar_eclipse.py
Hidden: the observer stands in Venus's antumbra and sees a dot on the Sun Left, the Sun, labelled light source. Middle, Venus, labelled blocking body, small. Its dark umbra closes to a point a short way behind it, and beyond that point the antumbra opens out towards the Earth on the right. An observer on the Earth, labelled observer, stands in the antumbra. A framed panel on the right shows what the observer sees: a small dark dot on the Sun's disc. Schematic, not to scale antumbra What the observer sees Venus, a dot on the Sun Light source the Sun Blocking body Venus Observer on the Earth in Venus's antumbra Venus crossing the Sun
The observer stands in Venus's antumbra and sees a small dark dot on the Sun: a transit of Venus.
Read more diagram · How eclipses, occultations and transits are computed · Drawn here, tools/figures/prim_case_venus_transit.py
Hidden: Jupiter blocks the observer's view of Io Top left, the Sun, labelled light source, lighting Io along a line. Left, Io, labelled lit body. Middle, Jupiter, labelled blocking body, with a pale band stretching left from it: seen from the Earth, anything in that band is behind Jupiter. Io sits inside the band. Right, an observer on the Earth, labelled observer, whose dotted line of sight towards Io ends at Jupiter. Schematic, not to scale seen from the Earth, Io is behind Jupiter here Light source the Sun Lit body Io Blocking body Jupiter Observer on the Earth Jupiter hides Io
The Sun lights Io, and the observer stands in Jupiter's shadow in Io's reflected light, so Io is hidden behind Jupiter.
Read more diagram · How eclipses, occultations and transits are computed · Drawn here, tools/figures/prim_case_satellite_occultation.py
Hidden: an asteroid blocks the starlight reaching part of the Earth Left, a star, labelled light source, sending parallel lines of light. Middle, a small asteroid, labelled blocking body. Behind it a narrow band, its shadow in starlight, reaches the Earth on the right, which is drawn as a disc with the band crossing it. An observer inside the band, labelled observer, loses the star. Observers outside the band see nothing happen. Schematic, not to scale the Earth outside the band: nothing happens Light source a star Blocking body an asteroid Observer on the Earth, in the shadow path An asteroid hides a star
An asteroid's shadow in starlight crosses the Earth as a narrow band. Only observers inside that band see the star disappear.
Read more diagram · How eclipses, occultations and transits are computed · Drawn here, tools/figures/prim_case_asteroid_occultation.py
The Moon's shadow crossing the Earth, and what one observer sees Left: the Earth's disc with the Moon's shadow on it, a wide pale penumbra around a small dark umbra, centred on an observer marked with a dot. Right: the observer's sky, with the Sun covered by the Moon. When played, the shadow slides across the Earth from left to right while, on the right, the Moon slides across the Sun, covering it fully only while the umbra is on the observer. The Moon's shadow crossing the Earth Observer on the Earth What the observer sees still frame: the Sun covered, totality Light source the Sun, behind Blocking body the Moon, the dark disc Schematic, not to scale A solar eclipse, animated
When played, the Moon's shadow slides across the Earth while, on the right, the Moon slides across the Sun as the observer at the dot sees it. The Sun is fully covered only while the umbra is on the observer. The still frame is totality.
Read more animation · How eclipses, occultations and transits are computed · Drawn here, tools/figures/prim_anim_solar.py
Darkened: the Earth blocks the sunlight reaching the Moon Left, the Sun, labelled light source. Middle, the Earth, labelled blocking body, with sunlight reaching it and its shadow stretching to the right. Right, the Moon inside that shadow, labelled darkened body. An observer on the Earth's night side, labelled observer, looks along a dotted line at the darkened Moon. Schematic, not to scale Light source the Sun Blocking body the Earth Darkened body the Moon in the Earth's shadow Observer on the Earth's night side Darkened case: a lunar eclipse
In a lunar eclipse the Earth blocks the sunlight on its way to the Moon, so the Moon goes dark for everyone on the Earth's night side, wherever they stand.
Read more diagram; 3D view on its page · How eclipses, occultations and transits are computed · Drawn here, tools/figures/prim_case_darkened.py
Darkened: Jupiter blocks the sunlight reaching Io Left, the Sun, labelled light source. Middle, Jupiter, labelled blocking body, with its shadow stretching to the right. Inside the shadow, Io, labelled darkened body. Below, an observer on the Earth, labelled observer, looks up along a dotted line at the darkened Io. Schematic, not to scale Light source the Sun Blocking body Jupiter Darkened body Io, in Jupiter's shadow Observer on the Earth Io in Jupiter's shadow
Jupiter blocks the sunlight on its way to Io, so Io goes dark for every observer who can see it.
Read more diagram · How eclipses, occultations and transits are computed · Drawn here, tools/figures/prim_case_satellite_eclipse.py
Darkened: Io blocks the sunlight reaching Jupiter's cloud tops Left, the Sun, labelled light source. Middle, Io, labelled blocking body, casting a long narrow shadow to the right. Right, Jupiter, labelled darkened body, with a small dark spot where Io's shadow meets its cloud tops. Below, an observer on the Earth, labelled observer, looks along a dotted line at the spot. Schematic, not to scale Light source the Sun Blocking body Io Darkened body Jupiter's cloud tops, a patch Observer on the Earth Io's shadow on Jupiter
Io blocks the sunlight on its way to a patch of Jupiter's cloud tops, which shows as a dark spot: a shadow transit.
Read more diagram · How eclipses, occultations and transits are computed · Drawn here, tools/figures/prim_case_shadow_transit.py
The Moon passing through the Earth's shadow The Earth's shadow at the Moon's distance, seen face on: a dark inner disc, the umbra, inside a paler ring, the penumbra. The Moon sits in the middle of the umbra, tinted copper. When played, the Moon moves from left to right through the penumbra and the umbra and out again, its copper tint deepening inside the umbra and fading outside it. the Earth's umbra the Earth's penumbra Darkened body the Moon Light source the Sun, behind the Earth Blocking body the Earth, casting this shadow Observer anyone on the Earth's night side Still frame: totality. The Moon is in the umbra and lit only by sunlight bent through the Earth's atmosphere. Schematic, not to scale A lunar eclipse, animated
When played, the Moon crosses the Earth's shadow and its copper tint deepens in the umbra, where only sunlight bent through the Earth's atmosphere reaches it. The still frame is totality.
Read more animation · How eclipses, occultations and transits are computed · Drawn here, tools/figures/prim_anim_lunar.py
One orbit of Io: four kinds of event A view from above Jupiter. Sunlight comes from the left, so Jupiter's shadow is a band to its right. The Earth lies off to the lower left, so Jupiter hides a band behind it to the upper right as seen from the Earth. Io's orbit is a dashed circle with four labelled places: on the Sun side its shadow falls on Jupiter; on the Earth side it crosses in front of Jupiter; behind Jupiter as seen from the Earth it is occulted; in the shadow it is eclipsed. Io sits in the shadow at the still frame. When played, Io goes round the orbit. A framed panel on the right shows what an observer on the Earth sees: Jupiter's disc with Io beside it, crossing in front, hidden behind or dark in the shadow, and Io's shadow as a dot on Jupiter, with the event's name lit. Jupiter's shadow hidden from the Earth Jupiter the planet Light source the Sun, this way Observer on the Earth, this way shadow transit transit occultation eclipse Io What the observer sees from the Earth transit shadow transit occultation eclipse Io and Jupiter swap roles from one event to the next. Schematic, not to scale; angles exaggerated One orbit of Io, animated
When played, Io goes once round Jupiter and passes the four places where each kind of event happens. The angle between the Sun and the Earth is exaggerated to separate them. The still frame shows Io in Jupiter's shadow.
Read more animation · How eclipses, occultations and transits are computed · Drawn here, tools/figures/prim_anim_io.py
Cone and cylinder: the two shapes of a shadow Top: a large source disc on the left and a small body in the middle. The umbra narrows behind the body to a point and opens out again beyond it as the antumbra. The wider penumbra spreads around both. Three observers sit in the umbra, the penumbra and the antumbra. A framed panel below shows what each one sees of the source disc: wholly covered with a faint corona around it, partly covered, and covered except for a ring. Bottom: parallel lines from a star at the far left pass a body and leave a straight band behind it, the cylinder, with an observer in it for whom the star is hidden. Light source the Sun, a disc Blocking body the Moon umbra antumbra penumbra What the observer sees in the umbra: total in the penumbra: partial in the antumbra: annular Light source a star: a point at infinity, so its light arrives in parallel lines Blocking body the Moon cylinder: no penumbra Observer the star is hidden Schematic, not to scale Cone and cylinder shadows
The source's size decides the shadow's shape: the Sun gives a cone whose umbra, penumbra and antumbra give total, partial and annular views, and a star gives a cylinder with no penumbra, so it vanishes at once.
Read more diagram · How eclipses, occultations and transits are computed · Drawn here, tools/figures/prim_shadow_shape.py
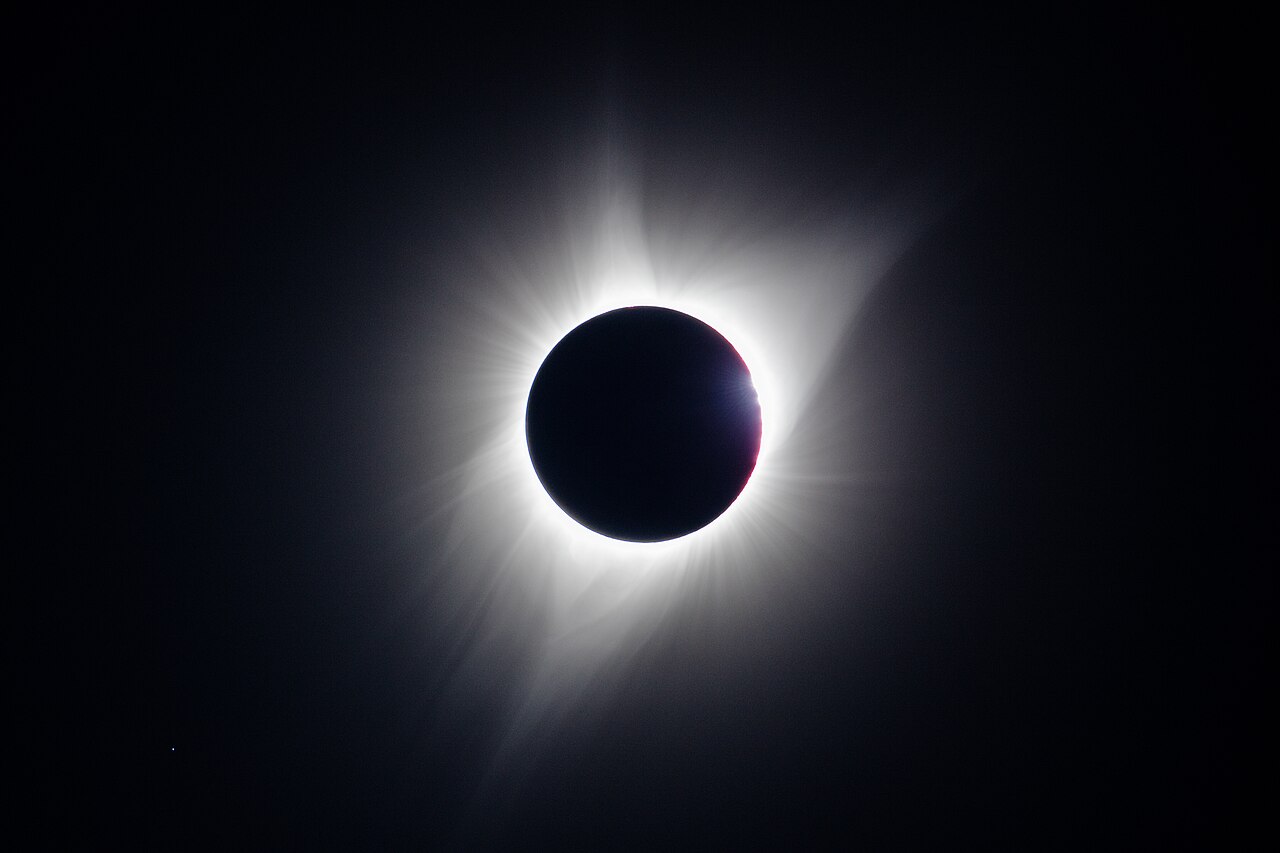
Baily's beads, 2017
Each bead is sunlight reaching the observer through one lunar valley, so the beads measure the limb profile directly, at the position angles where they appear. Totality begins only when the last of them closes, which is why a prediction that assumes a round Moon states the wrong second. National Park Service / Jacob W. Frank, Craters of the Moon, Idaho, 2017 August 21.
Read more photograph · Worked example: a solar eclipse · Third-party, Public domain. Source
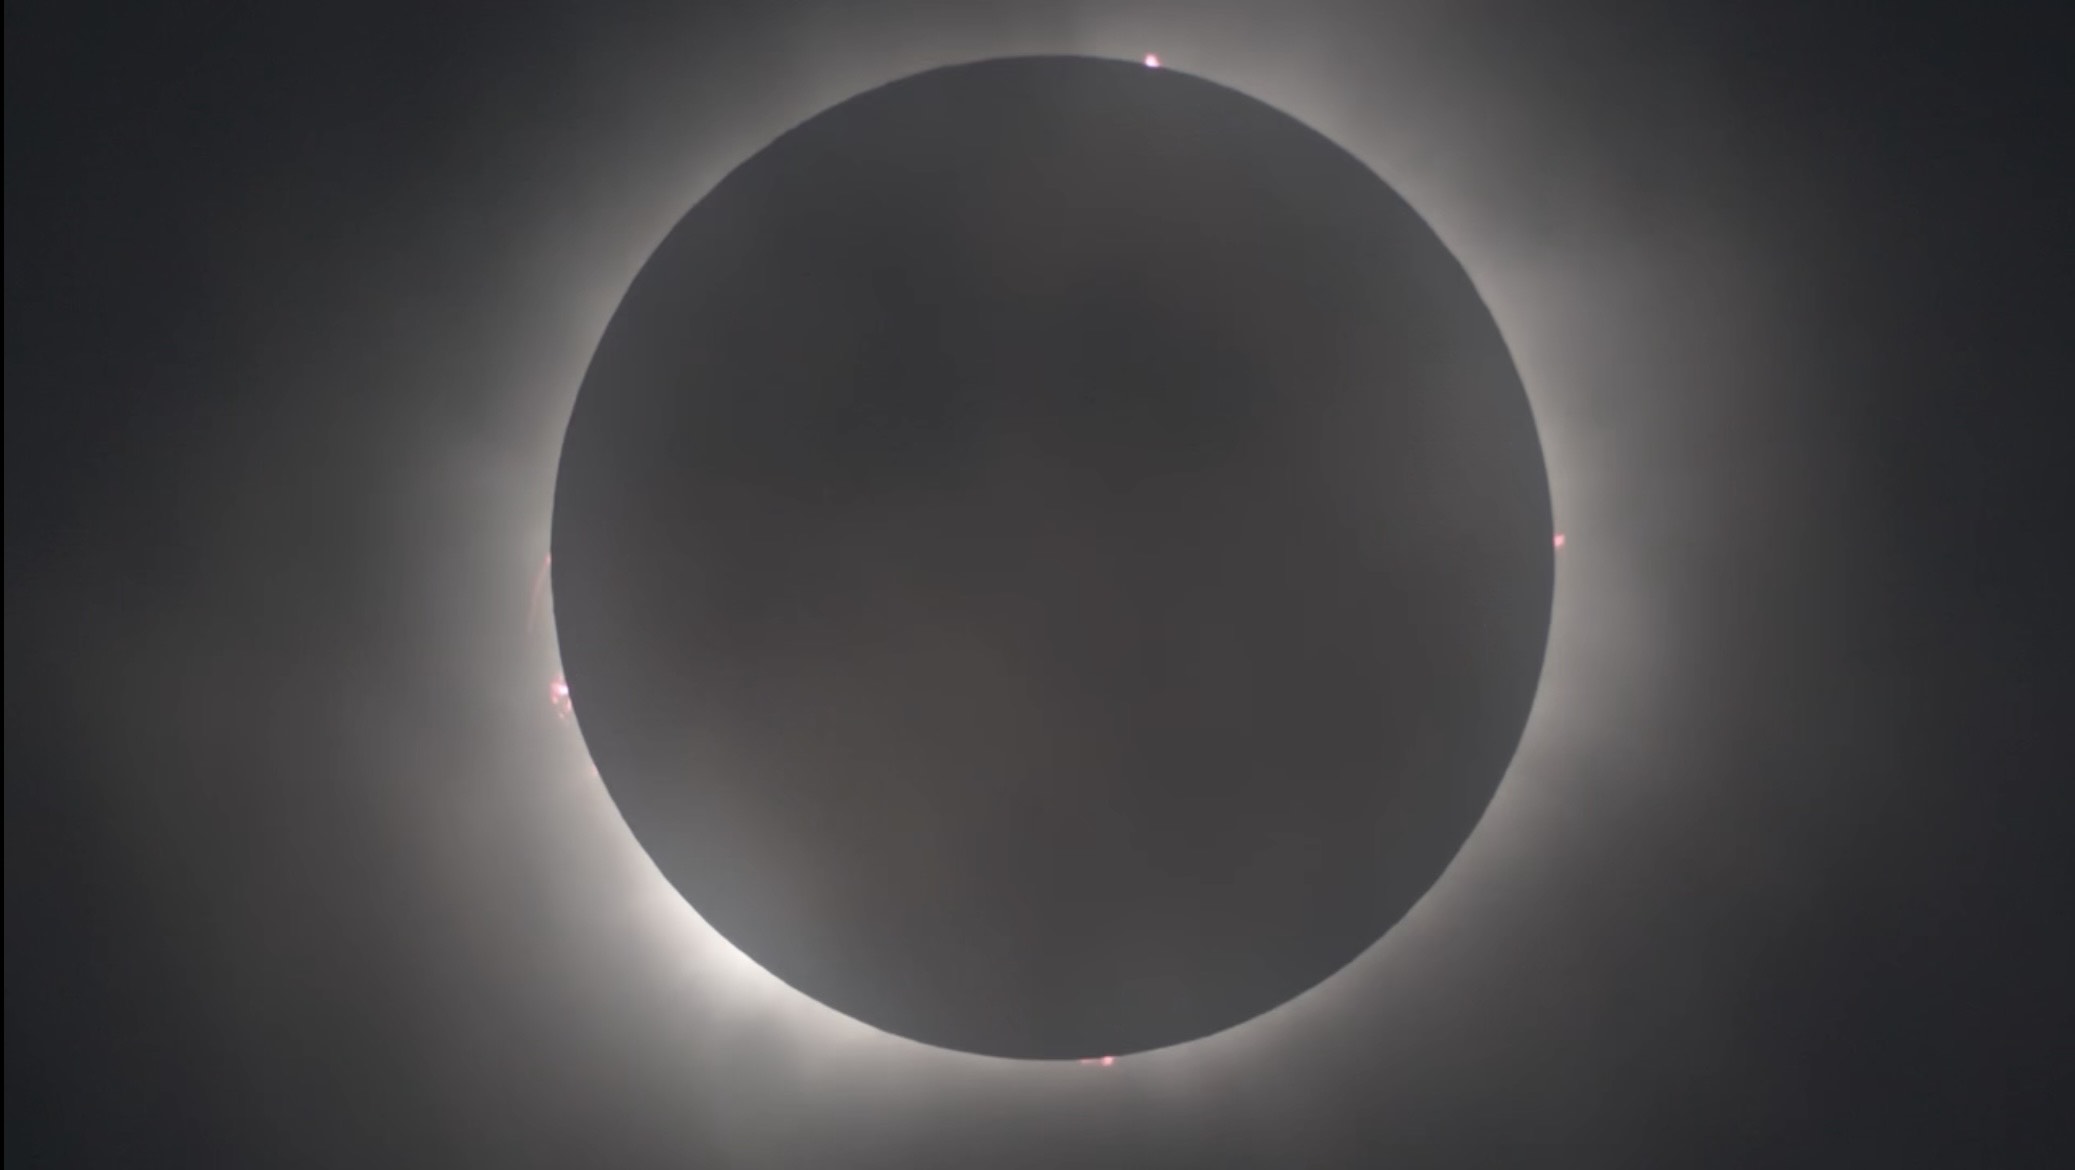
Totality at Kerrville, 2024
The corona is what the eye sees, but it is not what the computation solves for. Totality is the instant the last of the photosphere is hidden, and the photosphere has no sharp edge, so the moment has to be defined by a chosen radius rather than observed from the image. NASA's Scientific Visualization Studio, from Kerrville, Texas, 2024 April 8.
Read more photograph · Worked example: a solar eclipse · Third-party, Public domain. Source
The fundamental plane and the shadow cones A cross-section through the Sun, Moon and Earth. Tangents drawn to the outsides of the Sun and Moon form the umbral cone, which narrows to a vertex just inside the Earth. Tangents that cross between them form the penumbral cone, which widens past the Moon. A vertical line through the Earth's centre, perpendicular to the shadow axis, is the fundamental plane. The penumbral radius l1 and the much smaller umbral radius l2 are measured on that plane. fundamental plane perpendicular to the axis, through the Earth's centre l₁ l₂ negative: the vertex is past the plane Sun Moon Earth shadow axis umbral cone penumbral cone vertex Schematic. The Moon is drawn much larger relative to the Sun than it is. Fundamental plane and shadow cones
The umbral cone narrows to a vertex, and an eclipse is total wherever that vertex falls beyond the Earth's surface rather than short of it. Both shadow radii, l 1 l_1 l 2 l_2
Read more diagram · Besselian elements and the fundamental plane · Drawn here, tools/figures/fundamental_plane.py
The shadow on the fundamental plane The fundamental plane viewed along the shadow axis. The Earth is a circle of unit radius with its centre marked. An x axis runs east from that centre and a y axis runs north. Two concentric circles, the large penumbra of radius l1 and the small umbra of radius l2, are centred on the point (x, y) up and to the left of the Earth's centre. A line from the Earth's centre to that point is labelled gamma. x (east) y (north) γ l₁ penumbra l₂ (umbra) drawn much enlarged (x, y) the Earth's centre the Earth's disc, radius 1 Schematic. The umbral circle is drawn about ten times its true size; published elements give l₂ near 0.01 Earth radii against l₁ near 0.54. The shadow on the fundamental plane
Looking down the axis, the elements are two concentric circles crossing a disc of unit radius: x x y y l 1 l_1 l 2 l_2 γ \gamma x 2 + y 2 \sqrt{x^2+y^2}
Read more diagram; 3D view on its page · Besselian elements and the fundamental plane · Drawn here, tools/figures/besselian_xy.py
An observer raised by h meets the shadow edge h cot A sooner A cross-section. A solid horizontal line is the ellipsoid and a dashed horizontal line above it is the terrain at height h. A straight line inclined at sixty degrees, the Sun's altitude, is the edge of the umbra: it runs down from the upper right, crosses the terrain line at the observer, and meets the ellipsoid further to the left at the point where a sea-level map draws the limit. The horizontal gap between those two crossings, marked with a double arrow below the ellipsoid, is h cot A. Everything to the left of the edge is shaded as inside the umbra. Dotted rays parallel to the edge show the direction of the Sun. A panel lists the shift per thousand metres of elevation: 577 metres with the Sun at sixty degrees, 1000 metres at forty-five and 1732 metres at thirty. inside the umbra WGS 84 ellipsoid terrain at height h edge of the umbra to the Sun A = 60° h observer h cot A the limit drawn at sea level where the raised observer actually meets the edge Shift per 1000 m of elevation, with the Sun square to the limit: A = 60° 577 m A = 45° 1000 m A = 30° 1732 m Only the component across the limit counts, so the full shift is Δ⊥ = h cot A sin D, with D the angle between the Sun's azimuth and the limit line. Schematic. The height is exaggerated and the ellipsoid is drawn flat, but the drawn offset really is cot 60° of the drawn height. Terrain shifts the shadow edge
A raised observer meets the edge of the umbra before a sea-level map says so, displaced toward the Sun's azimuth by h cot A h \cot A
Read more diagram · Earth figure and terrain · Drawn here, tools/figures/terrain_shift.py
The standard error of ΔT against year A chart with the year from minus one thousand to plus three thousand along the horizontal axis and the standard error of delta T, in seconds, on a logarithmic vertical axis running from a tenth of a second to nearly two thousand. Ten points fall in a deep V, with the trough in the telescopic era. They drop from 636 seconds at year minus one thousand through 265 at year zero, 139 at 500, 54 at 1000 and 31 at 1200 to 5 seconds at 1700, 1 second at 1800 and a tenth of a second at 1900, then climb again to 612 seconds at 2500 and 1885 seconds at 3000. The last two, and only those, come from Huber's extrapolation and are drawn as open squares. A horizontal dashed line at 265 seconds marks the level above which the Five Millennium Canon draws a longitude gore on its maps. 0.1 s 1 s 10 s 100 s 1000 s -1000 0 1000 2000 3000 year standard error of ΔT 265 s: above this the Five Millennium Canon draws a longitude gore on the map from the observed record from Huber's extrapolation 636 s 0.1 s 1885 s One second of ΔT moves the whole eclipse 465 m in longitude at the equator and 356 m at latitude 40°. ΔT uncertainty by year
The plotted ΔT standard errors combine the historical model and telescopic-era estimates with Huber's future extrapolation. The 1900 estimate is 0.1 seconds. The future values are 612 seconds at +2500 and 1885 seconds at +3000. The dashed 265-second line marks the Five Millennium Canon's longitude-gore threshold.
Read more diagram · ΔT and Earth rotation · Drawn here, tools/figures/delta_t_uncertainty.py
Composition of the Five Millennium Catalog A horizontal bar chart of the 11,898 solar eclipses in the Five Millennium Catalogue by type. Partial is the longest bar at 4,200 eclipses or 35.3 per cent, annular next at 3,956 or 33.2 per cent, total next at 3,173 or 26.7 per cent, and hybrid a short bar at 569 or 4.8 per cent. Partial, annular and total are of comparable size; hybrid is smaller than any of them by a factor of about six. Five Millennium Catalog of Solar Eclipses, −1999 to +3000: 11,898 eclipses partial 4,200 (35.3%) annular 3,956 (33.2%) total 3,173 (26.7%) hybrid 569 (4.8%) 0 1,000 2,000 3,000 4,000 number of eclipses Five Millennium Catalog composition
Partial, annular and total eclipses occur in comparable numbers over five millennia, within nine percentage points of one another, while hybrids are rarer than any of them by a factor of about six. A product that treats hybrids as a special case is therefore handling 4.8% of eclipses, and one that cannot classify them at all is wrong about 569 rows.
Read more diagram · Enumerating eclipses · Drawn here, tools/figures/catalogue_composition.py
Partial, annular, total and hybrid eclipses Four cross-sections side by side, each with the Moon above and the curved surface of the Earth below. In the first the shadow axis passes clear of the Earth and only the penumbra lands, giving a partial eclipse. In the second the Moon is far away, the umbral cone closes to a vertex above the surface, and the widening antumbra reaches the ground, giving an annular eclipse. In the third the Moon is close, the vertex falls below the surface, and the umbra itself reaches the ground, giving a total eclipse. In the fourth a dashed arc marks every point as far from the Moon as the vertex is. The curved surface of the Earth crosses that arc twice. The middle of the surface lies inside the arc, nearer the Moon than the vertex, so the umbra reaches it and the eclipse is total there; beyond the two crossings the surface falls outside the arc, the vertex is short of the ground, and the eclipse is annular. Partial the axis misses the Earth only the penumbra lands vertex Annular vertex short of the surface antumbra reaches the ground vertex Total vertex beyond the surface the umbra reaches the ground vertex T A A Hybrid the surface crosses the vertex distance: total (T) inside, annular (A) beyond Schematic. The cone angle, the Moon's size and the spread of its distance are exaggerated; the real vertex falls near the surface. The four eclipse types
One quantity separates the four types: where the vertex of the umbral cone falls relative to the Earth's surface. It falls short for an annular eclipse, so the widening antumbra lands; it falls beyond for a total one, so the umbra itself lands; and for a hybrid it falls between the two, so the same eclipse changes type along its own path. The dashed arc in the fourth panel carries every point as far from the Moon as the vertex is: the middle of the path lies inside it and is total, the ends lie outside it and are annular. A partial eclipse is the case where the axis misses the Earth and only the penumbra lands.
Read more diagram; 3D view on its page · Types and classification · Drawn here, tools/figures/eclipse_types.py
Eclipse classification in the gamma-u plane A plot of the absolute value of gamma against the umbral radius u, both in Earth equatorial radii. A nearly horizontal line at gamma = 1.5433 + u divides no eclipse above from partial below. A horizontal line at gamma = 0.9972 divides partial above from central below, with a very thin wedge between 0.9972 and 0.9972 + the absolute value of u holding the non-central umbral eclipses. The central region is cut vertically at u = 0, with total to the left and annular to the right, and a narrow wedge beside u = 0 bounded by the curve u = 0.00464 times the square root of one minus gamma squared holds the hybrid eclipses. A second, smaller panel on the right repeats the non-central wedge on a stretched gamma axis running from 0.990 to 1.030. 0.0 0.5 1.0 1.5 -0.02 -0.01 0 +0.01 +0.02 no eclipse |γ| = 1.5433 + u partial |γ| = 0.9972 total u < 0 annular u = 0.0047 hybrid u < 0.00464√(1 − γ²) |γ| u, the umbral radius on the fundamental plane (Earth equatorial radii) Detail: the non-central band 0.9972 < |γ| < 0.9972 + |u| 0.9972 1.0172 -0.02 0 +0.02 u partial non-central umbral central Every boundary is one of Meeus's inequalities; nothing else is plotted. u is the umbral radius on the fundamental plane, the same quantity as l₂. Classification in the gamma-u plane
Two of the six regions are thin, which is why the classification is delicate. Every boundary drawn is one of Meeus's inequalities: the non-central umbral band is only | u | |u| | γ | |\gamma| u = 0.00464 1 − γ 2 u = 0.00464\sqrt{1-\gamma^2}
Read more diagram · Types and classification · Drawn here, tools/figures/gamma_u_classification.py
The umbral path and its limits on the Earth's disc The Earth is drawn as a disc seen from the Sun. A pale region covers most of the disc and is labelled the penumbral outline, its edge a dashed arc low on the disc. A curve runs from limb to limb across the upper half of the disc: the central line, the track of the shadow axis. Five small dark ellipses sit on that curve at successive instants, each the umbra on the ground, smallest near the middle of the path and larger toward its ends where the surface tilts away. Two further curves, one dashed and one dotted, run either side of the central line and touch every one of the five ellipses. They are the northern and southern limits, drawn as the envelope of the moving ellipse, and they spread apart toward the ends of the path as the ellipses grow. northern limit southern limit central line the shadow axis on the ground the umbra at five instants each ellipse touches both limits, which is what makes them limits penumbral outline the partial phase is under way inside it the Earth as seen from the Sun Schematic. The umbra is drawn far larger, relative to the Earth, than it ever is. Umbral path and its limits
A limit is the envelope of the moving umbra. Every point on it is touched by the shadow's edge at one instant only, which is why the condition solved for it is that the eclipse begins and ends at the same moment, and not a separate curve fitted to the map.
Read more diagram · Path and limits · Drawn here, tools/figures/path_and_limits.py
The observer reduced to the fundamental plane Two panels. The left panel is a cross-section through the Earth. A vertical line through the Earth's centre is the fundamental plane, perpendicular to the shadow axis, which runs horizontally toward the Sun. An observer sits on the surface on the sunward side, at geodetic latitude phi measured from the equator, and a horizontal segment from the observer to the plane is labelled zeta, the height above the plane. The right panel shows that plane face-on, with axes xi to the east and eta to the north from the Earth's centre. The observer's projection sits below and left of the centre and the shadow axis above and right of it. A horizontal segment labelled u and a vertical segment labelled v join the two, and the straight line between them is m. Four circles are centred on the shadow axis: the penumbral and umbral radii as tabulated on the plane, dotted, and the same two radii shrunk to the observer's own plane, dashed and solid. a cross-section through the observer the plane itself, seen from the Sun to the Sun fundamental plane equator φ observer ζ height above the plane η ξ points out of the page Earth ξ η centre u = x − ξ v = y − η m (ξ, η) (x, y) the shadow axis L₁ L₁′ L₂′ dotted: L₁ and L₂, the radii tabulated on the plane L₁′ = L₁ − ζ tan f₁ L₂′ = L₂ − ζ tan f₂ the same radii shrunk to the observer's own plane, ζ away Schematic. The coordinates drawn are chosen for legibility, not computed for any eclipse. Observer reduced to the plane
Every symbol in the reduction is a length in one of two planes. The observer's height ζ above the fundamental plane fixes how far the two shadow radii shrink, and the in-plane difference ( u , v ) (u, v)
Read more diagram · Contact times, magnitude and position angles from Besselian elements · Drawn here, tools/figures/observer_reduction.py
The four contacts as tangencies of the solar and lunar discs Four panels in a row, each showing the Sun as a light disc and the Moon as a slightly larger grey disc, with a dotted line through both marking the Moon's path relative to the Sun and an arrow showing it moving to the left, eastward. In the first panel the two discs touch from outside on the right of the Sun: first contact, the beginning of the partial phase. In the second the lunar disc has just swallowed the solar one and touches it from inside: second contact, the beginning of totality. In the third the discs touch from inside on the opposite side: third contact, the end of totality. In the fourth they touch from outside on the left: fourth contact, the end of the partial phase. On the fourth panel a line runs from the Sun's centre up to its north point and another to the point of tangency, with an arc between them labelled P, the position angle, opening counter-clockwise from north through about ninety degrees. the two discs as the observer sees them: north up, east to the left C1 exterior tangency the partial phase begins C2 interior tangency totality begins C3 interior tangency totality ends C4 exterior tangency the partial phase ends N P P is measured eastward from the north point of the solar limb the Moon's path relative to the Sun Schematic. At the interior contacts the two limbs are drawn four pixels apart. The four solar eclipse contacts
A contact is a tangency of the two discs, which is why C1 and C4 are roots of m = L 1 ′ m = L_1' m = | L 2 ′ | m = |L_2'| P P
Read more diagram · Contact times, magnitude and position angles from Besselian elements · Drawn here, tools/figures/contact_configurations.py
Obscuration against magnitude for equal apparent discs A square plot with magnitude from zero to one along the horizontal axis and obscuration from zero to one up the vertical axis. A dashed straight line runs corner to corner where obscuration would equal magnitude. The computed curve starts at the same origin, stays well below that line throughout, rising slowly at first and steeply near the right, and meets it again only at the top right corner where the discs coincide. A marked point on the curve shows that a magnitude of 0.50 corresponds to an obscuration of 0.391. 0.0 0.0 0.2 0.2 0.4 0.4 0.6 0.6 0.8 0.8 1.0 1.0 magnitude, the fraction of the solar diameter obscuration obscuration 0.391 at magnitude 0.50 apparent radius ratio s = 1.00, equal discs magnitude is the fraction of the solar diameter covered obscuration is the fraction of the solar area covered obscuration = magnitude the computed curve which lies below it at every magnitude short of one Computed from the lens-area formula of the 1961 Explanatory Supplement, section 9D. Obscuration against magnitude
For equal apparent discs, obscuration runs below magnitude before totality. A magnitude of 0.50 covers 0.391 of the solar area. The curve is computed from the lens-area formula quoted above, section 9D of the 1961 Explanatory Supplement.
Read more diagram · Contact times, magnitude and position angles from Besselian elements · Drawn here, tools/figures/magnitude_obscuration.py
The true lunar limb against the mean limb A circle stands for the mean lunar limb. A closed wiggly curve drawn around it is the true limb, departing inward and outward by up to about two and a half arcseconds, with the departure exaggerated about fifty-seven times. Position angle is marked at zero, ninety, one hundred and eighty and two hundred and seventy degrees, measured from the Moon's north pole through east. Near position angle sixty-six degrees the true limb bulges outside the circle at a mountain peak, and near one hundred and fourteen degrees it dips inside the circle at a valley. The peak region and the valley region are shaded and labelled: the peak hides the Sun early, the valley still lets sunlight through after the nominal second contact. PA 0°, lunar north PA 180° PA 270° PA 90°, east nominal contact point mean limb, and the Sun's limb at nominal C2 Peak at PA 66° The Moon already covers the Sun here, so the light at this angle is cut off before nominal C2. Valley at PA 114° Sunlight still reaches the observer through this valley after nominal C2, so second contact comes late. Position angle runs from the Moon's north pole through east. Schematic. The relief is exaggerated about 57 times, and the profile is invented rather than real LOLA data. True and mean lunar limb
The Moon's silhouette departs from a circle by up to about three arcseconds, so second contact is fixed not by the mean limb but by whichever valley is the last to let sunlight through and whichever peak is the first to cut it off.
Read more diagram · Limb profile methods · Drawn here, tools/figures/limb_profile.py
Baily's beads as gaps between the solar limb and the lunar profile A chart with the angle from the nominal point of second contact along the horizontal axis, from minus forty to plus forty degrees, and limb height in arcseconds above the mean lunar limb on the vertical axis. A jagged curve is the lunar limb profile, with the Moon's body shaded below it. A shallow downward-curving line is the Sun's limb a few seconds before second contact. Wherever the profile lies below that line a narrow sliver of sunlight survives, and four such slivers are shaded and labelled as beads. A dotted copy of the same curve, lower on the chart, has sunk until the last of those slivers closes: that is second contact. mean limb -40° -20° 0° 20° 40° C, the angle from the point of nominal second contact -1 0 +1 +2 limb height, arcseconds outward boundary = base − h M = 1.0016 the Sun's limb a few seconds before second contact dotted: the same curve at second contact, when the last bead goes out beads: sunlight surviving in the valleys Schematic. The profile is invented, and the height scale is exaggerated against the angle scale by about a thousand times. How Baily's beads form
A bead is the gap between the Sun's limb curve and a valley floor, so the beads go out one by one as that curve sinks, and second contact is the instant the last of them closes.
Read more diagram · Baily's beads · Drawn here, tools/figures/bailys_beads.py
Solar radius values in arcseconds at 1 au, with uncertainties A dot chart on a horizontal axis running from 959.1 to 960.2 arcseconds. Two standards are drawn as open squares: Auwers 1891 at 959.63 with an error bar of plus or minus 0.05, and the IAU 2015 nominal radius at 959.22 with no error bar. Six eclipse determinations are drawn below them as filled circles: Kubo's range of 959.74 to 959.88 as a bar, Adassuriya 959.89 plus or minus 0.18, Quaglia 959.95 plus or minus 0.05, Jubier 959.98, Lamy 959.99 plus or minus 0.06 and Guhl 960.01. A dashed vertical line at 959.63 marks the standard still in use, and a shaded band from 959.95 to 960.01 shows that the modern eclipse values cluster about a third of an arcsecond above it. 959.2 959.4 959.6 959.8 960.0 960.2 solar angular semidiameter at 1 au, arcseconds Standards in use, drawn as open squares Eclipse determinations, drawn as filled circles Auwers 1891 959.63 ± 0.05 IAU 2015 nominal 959.22 Kubo 1993 959.74 to 959.88 Adassuriya 2011 959.89 ± 0.18 Quaglia 2021 959.95 ± 0.05 Jubier 2021 959.98 Lamy 2015 959.99 ± 0.06 Guhl 2023 960.01 959.63″, the standard still in use the eclipse values cluster here The eclipse values measure the last photospheric light, about 0.32 arcseconds beyond Auwers' 19th-century limb. Solar radius values compared
The eclipse determinations cluster near 959.95 to 960.01 arcseconds, about a third of an arcsecond above the 959.63 arcseconds that the almanacs and most predictors still use, and about three quarters of an arcsecond above the IAU 2015 nominal radius.
Read more diagram · Solar radius values and their provenance · Drawn here, tools/figures/solar_radius_values.py
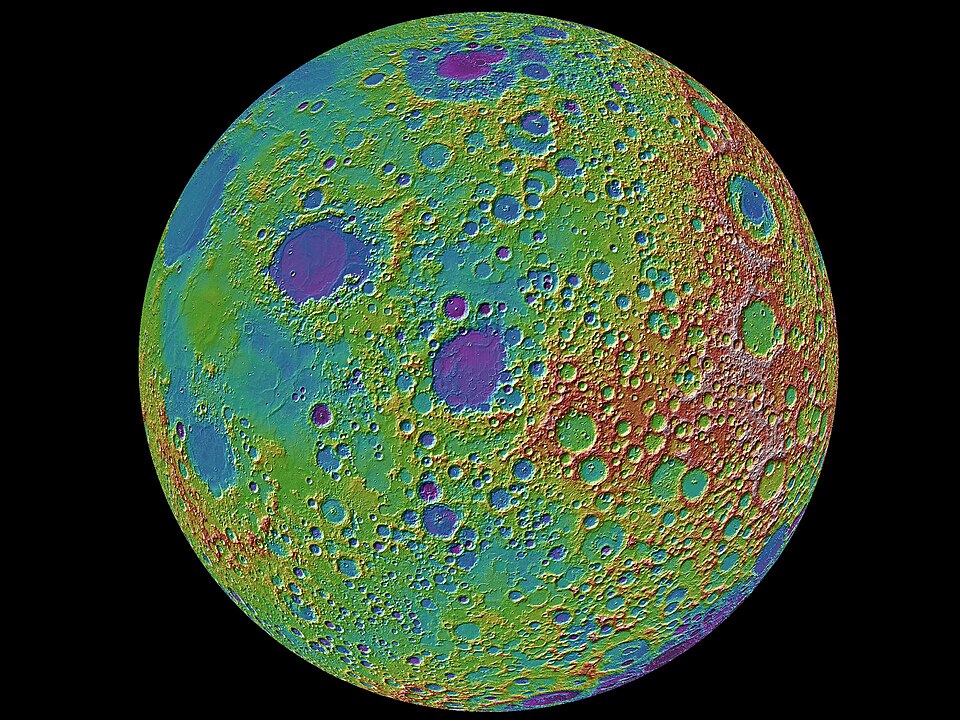
LOLA topography, eastern limb
The relief the profile is drawn from. Colour codes elevation over the eastern limb, from 2.4 billion LOLA shots. The profile is not a picture of this surface but one number per 0.02° bin, the largest angular radius any point in that bin presents to the observer, so a far-side peak can enter the limb and a near-side plain never does. NASA/Goddard/MIT/Brown.
Read more photograph · Wright and Young 2024, the raster method · Third-party, Public domain. Source
The four contacts of a planetary transit A large circle is the solar disc with north at the top and east on the left. A dashed horizontal line above the centre is the planet's path, crossed from left to right. Four small circles sit on the path. The two outer ones, labelled I and IV, touch the solar limb from outside. The two inner ones, labelled II and III, touch it from inside. A filled circle marks the planet at greatest transit, directly above the solar centre, and a short vertical segment labelled b joins it to the centre. A line from the centre to contact II, and an arc from the north direction to that line, show the position angle P. A panel on the right states the contact condition. N E path I II III IV b greatest transit P ingress egress Contact condition separation of centres = L I and IV: L = s☉ + s_p II and III: L = s☉ − s_p b: least separation of centres P: position angle, north through east A larger s☉ moves I and II earlier and III and IV later. Schematic, geocentric. The planet is drawn about twenty times too large relative to the Sun. The four transit contacts
Contacts I and IV are external tangencies and II and III internal ones, so a larger solar semidiameter moves I and II earlier and III and IV later. The least separation b b P P
Read more diagram · Enumerating transits and their elements · Drawn here, tools/figures/tr_contact_geometry.py
Contact-time shift per arcsecond of contact radius A chart with the ratio of least separation to contact radius, b over L, from zero to 0.95 along the horizontal axis and the shift of a contact in seconds of time per arcsecond of contact radius, from zero to forty, on the vertical axis. Two rising curves start flat and steepen towards the right. The solid curve, for a relative motion of 240 arcseconds per hour, starts at 15 seconds per arcsecond. The dashed curve, for 355 arcseconds per hour, starts at about 10. Two open circles on the solid curve mark the 2012 and 2004 Venus transits near 19 and 21 seconds per arcsecond. Two squares mark the 2016 Mercury transit on the solid curve near 16 and the 2019 Mercury transit on the dashed curve near 10. 0 s 10 s 20 s 30 s 40 s 0.0 0.2 0.4 0.6 0.8 b / L: least separation over contact radius seconds of time per arcsecond of L n = 240″/h n = 355″/h 2004 Venus: 20.5 s 2012 Venus: 18.8 s 2016 Mercury: 15.9 s 2019 Mercury: 10.2 s Venus, interior contacts Mercury, interior contacts Computed from the Explanatory Supplement contact solution; geocentric, parallax not included. Transit timing per arcsecond
Per arcsecond of contact radius, an interior contact moves 10 seconds of time in the near-central 2019 Mercury transit and 21 seconds in the 2004 Venus transit. The curves are 3600 / ( n 1 − ( b / L ) 2 ) 3600/(n\sqrt{1-(b/L)^2}) b b n n
Read more diagram · Transit contacts and local circumstances · Drawn here, tools/figures/tr_radius_sensitivity.py
The six contacts of a total lunar eclipse Two concentric circles centred on the shadow axis: the larger is the penumbra and the smaller the umbra. A straight line, the Moon's track, crosses them above the centre, with a short perpendicular marked gamma from the centre to the track. Seven outlined Moon disks sit on the track from right to left: P1 touching the outside of the penumbra, U1 touching the outside of the umbra, U2 just inside the umbra, G at the point nearest the centre, U3 just inside the umbra on the other side, U4 touching its outside, and P4 touching the outside of the penumbra. Penumbral contacts are drawn dashed and umbral contacts solid. γ P1 U1 U2 G U3 U4 P4 penumbra umbra Moon's motion north up, east left Schematic to scale in Earth radii (ρ = 1.2848, σ = 0.7403, k = 0.2725, γ = 0.35); the straight track and its tilt are idealised. Six contacts of a lunar eclipse
The six contacts are the instants when the Moon's track meets the circles at distances ρ + k \rho + k σ + k \sigma + k σ − k \sigma - k u = 0 u = 0
Read more diagram · Enumeration, elements and contacts · Drawn here, tools/figures/lun_contacts.py
Atmospheric layer height implied by three umbra-enlargement rules A line chart. The horizontal axis is the Moon's distance from 56 to 64 equatorial Earth radii. The vertical axis is the height in kilometres of the atmospheric layer that each rule effectively adds to the Earth. Chauvenet's 2 per cent rule is a solid line falling from about 94 km at 56 Earth radii to about 90 km at 64 Earth radii. Danjon's factor 1.01 is a dashed horizontal line near 74 km. Herald and Sinnott's 0.0136 Earth radii, evaluated at a contact angle of 45 degrees, is a dotted horizontal line near 86.6 km. A shaded band from 82.2 to 90.7 km shows the spread of single-eclipse mean heights that Herald and Sinnott report. single-eclipse means, 82.2 to 90.7 km (Herald and Sinnott) 56 58 60 62 64 lunar distance, equatorial Earth radii 70 80 90 100 implied layer height, km Chauvenet, 1.02 solid; varies with distance Herald and Sinnott, h = 0.0136 dotted; 86.6 km at θ = 45° Danjon, 1.01 dashed; 74 km Computed from the quoted formulas with the Sun at 1 au; heights are above the 45-degree radius 0.998340. Three umbra-enlargement rules compared
Chauvenet's 2 per cent rule is equivalent to a layer that thins from about 94 to 90 km as the Moon recedes, while Danjon's factor 1.01 and Herald and Sinnott's h = 0.0136 h = 0.0136 θ = 45 ∘ \theta = 45^{\circ} θ = 0 ∘ \theta = 0^{\circ} θ = 90 ∘ \theta = 90^{\circ}
Read more diagram · Shadow geometry and enlargement · Drawn here, tools/figures/lun_shadow_rules.py
The fundamental plane of a lunar occultation The fundamental plane seen along the line from the star. The Earth is a circle of unit radius with x running east and y running north from its centre. A straight track, rising gently from left to right, crosses near the top of the Earth's disc; it is the path of the centre of the Moon's shadow. Three circles of radius k are drawn on the track, at one hour before conjunction, at conjunction and one hour after; the middle one is solid and the other two are dashed. Two dotted lines parallel to the track, one above and one below, bound the band the circle sweeps. The lower line cuts across the Earth's disc and is labelled southern limit; the upper line lies wholly off the disc and is labelled northern limit. A vertical dimension on the left marks Y, the height of the track above the Earth's centre at conjunction, and an arrow inside the middle circle marks its radius k. x (east) the Earth's centre the Earth's disc, radius 1 track of (x, y) northern limit southern limit T₀ − 1 h T₀ T₀ + 1 h k Y Schematic from the elements of ES 1961 Example 10.2: Y = +0.9753, x′ = +0.6046, y′ = +0.0543, k = 0.2725. The Earth's rotation is not drawn, so the band shows the shadow's sweep on the plane, not the zone on the ground. Lunar occultation fundamental plane
For a star the Moon's shadow is a circle of fixed radius k = 0.2725 k = 0.2725 k k Y = + 0.9753 Y = +0.9753
Read more diagram · Besselian elements for lunar occultations · Drawn here, tools/figures/occ_fundamental_plane.py
Predicting and reducing a stellar occultation on the fundamental plane Two panels. Left: a circle for the Earth seen from the star, crossed diagonally by a band of constant width, the shadow of the occulting body. A dashed central line runs along the middle of the band, and a dashed line lies parallel to each edge, outside it, marking the 1-sigma uncertainty. An arrow shows the direction of motion. Right: an ellipse for the body's outline with four horizontal solid chords across it, each ending in two dots, and one dotted horizontal line that misses the ellipse. A small plus marks the ellipse centre and a small open circle marks the ephemeris position, joined by a short arrow labelled as the astrometric offset. x y motion fundamental plane, seen along the star direction 1σ line: edge shifted by the cross-track uncertainty shadow: width D, the body's diameter central line Earth miss chord ephemeris position fitted centre after the event: chords on the same plane ellipse fit gives a′, b′, its angle and the offset star motion relative to the body Schematic. Widths, uncertainty and shape are illustrative, not an event. Occultation shadow path and chords
On the fundamental plane the shadow band has the body's own width, and the dashed 1-sigma lines sit one cross-track uncertainty outside each edge. After the event, chords at several offsets fix an ellipse whose centre, compared with the ephemeris position, is the astrometric result.
Read more diagram · Prediction geometry and astrometry · Drawn here, tools/figures/mb_shadow_path.py
Eclipse, occultation, transit and shadow transit of a Galilean satellite A view from above Jupiter's north pole. Sunlight arrives from the left. A shaded band, Jupiter's shadow, extends to the right of the planet. A circle around Jupiter is a satellite's orbit, traversed counterclockwise. An arrow from Jupiter points down and to the left towards the Earth, at an angle to the sunlight. Two dashed lines tangent to Jupiter and parallel to the Earth direction mark the corridor that the Earth sees as Jupiter's disc. Four satellite positions are labelled: shadow transit on the Sun side, eclipse inside the shadow band, occultation inside the dashed corridor behind Jupiter, and transit inside the dashed corridor in front of Jupiter. The eclipse and occultation positions are separated by the angle between the Sun and Earth directions. sunlight to the Earth Jupiter orbital motion shadow transit its shadow falls on the disc eclipse satellite inside the shadow occultation satellite behind the disc transit satellite in front of the disc phase angle Jupiter's shadow: umbra darker, penumbra lighter Schematic, viewed from above Jupiter's north pole. Not to scale. The phase angle is drawn as 35 degrees; at Jupiter it never exceeds about 12 degrees. Four Galilean satellite phenomena
The two Sun-fixed zones and the two Earth-fixed zones of one orbit are separated by Jupiter's phase angle, so an eclipse and an occultation of the same satellite are distinct events at distinct times.
Read more diagram · Eclipses, occultations, transits and shadow transits · Drawn here, tools/figures/jup_phenomena.py
Saturn's globe and ring edges at a ring opening of 20 degrees Five concentric ellipses centred on Saturn, numbered 1 to 5, show the outer and inner edges of ring A, the outer and inner edges of ring B and the inner edge of ring C. Rings A, B and C are shaded alike. The gap between edges 2 and 3 is the Cassini Division. The flattened globe sits in the middle and hides the middle of the back arc of each ellipse, while the front arc crosses in front of it. An arrow marks half the major axis of edge 1 and a dashed line marks half its minor axis. a/2 b/2 = (a/2) sin|B| 1 outer edge of ring A, 1.0000 a 2 inner edge of ring A, 0.8801 a 3 outer edge of ring B, 0.8599 a 4 inner edge of ring B, 0.6650 a 5 inner edge of ring C, 0.5486 a globe to scale with the rings: equatorial radius 60,268 km polar radius 54,364 km Data figure. Edges at Meeus's fractions of a = 375.35″/Δ, with B = 20° and P = 0. Shading marks the ring bands only. It does not show optical depth. Saturn's globe and rings
At a ring opening of 20 degrees the outer edge's minor axis is a third of its major axis, and the flattened globe hides the middle of the back of every ring edge while the front passes across it. Edges follow Meeus's fractions of a = 375.35 ″ / Δ a = 375.35''/\Delta
Read more diagram · Saturn's satellite theories and ring geometry · Drawn here, tools/figures/sats_ring_ellipse.py
Ring-plane crossings of Saturn by the Sun and the Earth, 1995 to 2025 A horizontal time axis runs from 1993 to 2028 with ticks every five years. An upper row of circles marks the three Sun crossings in November 1995, August 2009 and May 2025. Brackets between them give the intervals, 13.72 years and 15.74 years. A lower row of diamonds marks the Earth crossings: three in 1995 and 1996, one in 2009 and one in 2025. 1995 2000 2005 2010 2015 2020 2025 Sun Earth 1995-11-19 2009-08-10 2025-05-06 13.72 years 15.74 years two intervals sum to 29.46 years, about one Saturnian year Data figure. Circles: Sun crossings (Saturnian equinoxes). Diamonds: Earth crossings. Saturn ring-plane crossings, 1995 to 2025
Saturn's equinoxes alternate between a short and a long half of its orbit, 13.72 and 15.74 years apart, and the Earth crosses the ring plane once or three times near each.
Read more diagram · Phenomena and mutual events of Saturn's satellites · Drawn here, tools/figures/sats_crossing_timeline.py
The nine-stage eclipse computation pipeline A flow chart read from top to bottom. A configuration record sits above everything, followed by stage 1, the ephemeris, orientation and time layer, which spans the full width. Below it the flow splits in two. The left column is the elements path: stage 2 enumeration, stage 3 Besselian elements, stage 4 global circumstances, stage 5 partial-eclipse maps and stage 6 local circumstances. The right column is a single dashed box, the direct topocentric path, which root-finds on apparent topocentric places and takes no Besselian elements. An arrow leads from it back into stage 6, labelled as a cross-check the two paths must pass to 0.1 seconds. Below stage 6 the flow is one column again: stage 7 terrain, stage 8 lunar limb and stage 9 products with uncertainty. A bracket down the left edge marks stages 1 to 6 as almanac mode and stages 7 and 8 as what edge mode adds; stage 9 belongs to both. Configuration record, fixed before stage 1 and printed with every product ephemeris, lunar orientation, ellipsoid, s₀, k₁, k₂, terrain, ΔT, time scale, refraction 1 Ephemeris, orientation and time apparent places of Sun and Moon, sidereal time, topocentric libration, ΔT as metadata elements path direct topocentric path 2 Enumeration and provisional type lunations, γ and u, type, Saros 3 Besselian elements x, y, d, μ, l₁, l₂, tan f₁, tan f₂ 4 Global circumstances, smooth Moon central line, limits, durations, width 5 Partial-eclipse maps magnitude and obscuration contours 6 Local circumstances, smooth Moon contacts, magnitude, obscuration, P and V Direct topocentric path root-find δ(t) = rₛ ± rₘ on the apparent topocentric places of stage 1, with no elements formed site-level work and limb tests cross-check the two paths agree to 0.1 s 7 Terrain SRTM GL1 or Copernicus GLO-30 orthometric height plus geoid undulation 8 Lunar limb LOLA profile binned to 18,000 elements, then umbra polygons, true limits and beads 9 Products with uncertainty error-budget rows summed in quadrature, limits drawn at s₀ and s₀ ± σ almanac mode: stages 1 to 6 edge mode adds 7 and 8 both modes Schematic. Stage numbers follow the pipeline design note. A dashed outline marks the path that forms no elements. The nine-stage pipeline
Two computational paths leave the same ephemeris layer, and the design's only true cross-check is that they meet again at local circumstances within 0.1 s. Almanac mode ends at stage 6, and terrain and the lunar limb are what edge mode adds.
Read more diagram · Solar eclipse pipeline · Drawn here, tools/figures/pipeline_stages.py
The ranked error budget, as position error at an eclipse limit A horizontal bar chart on a logarithmic axis running from one metre to ten kilometres. Twenty terms from the error budget are ranked from largest to smallest. Two implementation bugs head the list at tens of kilometres: a geometric Sun paired with an apparent Moon at 38 km and TT used where UT belongs at 32 km, with a sphere used instead of the ellipsoid at 21 km behind them. Three shaded bars follow at kilometre scale and are the terms the corpus calls dominant: terrain omitted at up to 3 km, the lunar limb omitted at 1 to 3 km, and the choice of solar radius at 600 m. Below them the lunar radius constant, the centre-of-figure offset and the delta T prediction error lie between 400 m and 1.4 km. Watts-era, sidereal-time and UT1/UTC effects also exceed 200 m. The ephemeris terms at the foot are comparisons between releases, not accuracy bounds against truth. Bars mix model omissions, differences and uncertainty components; they cannot all be summed in quadrature. 1 m 10 m 100 m 1 km 10 km 38 km 1 Geometric Sun with apparent Moon 32 km 2 TT used as UT up to 21 km 3 Sphere instead of ellipsoid up to 3 km 4 ▸ Terrain omitted 1 to 3 km 5 ▸ Lunar limb omitted 1.4 km 7 Lunar radius k, umbral, IAU value 0.5 to 1 km 9 Centre of figure against centre of mass 500 to 800 m 8 ΔT prediction error, realised in 2024 600 to 750 m 10 Watts-era limb data 600 m 6 ▸ Solar radius 959.63″ against 959.95″ up to 500 m 17 Sidereal time, mean against apparent up to 420 m 18 UT1 against UTC up to 170 m 11 Geoid against ellipsoid height 60 to 130 m 12 Implementation spread, identical inputs 100 m band 13 Solar radius residual, ± 0.05″ under 20 m 24 Nutation, 1980 against 2000A 16 m 21 Ephemeris, DE403 to DE421, at 2020 10 m 22 ELP-2000/82 truncated as in the Canon about 10 m 23 Polar motion 2 m 25 TT against TDB edge position error, metres, log scale rank term, as the error budget ranks it ▸ the three terms the corpus calls dominant. A tick inside a bar marks the low end of a stated range. The ranked error budget
Mixed reduction and time conventions produce errors of tens of kilometres. Terrain and limb omission reach kilometres, and the cited 0.32 arcsecond solar-radius difference moves a limit by about 600 m. Several other omitted corrections also exceed 200 m. The ephemeris bars are comparisons between releases, not bounds against truth. Each bar is a diagnostic scale from the table above.
Read more diagram · Solar eclipse error budget · Drawn here, tools/figures/error_budget.py