Wright and Young 2024, the raster method
- Citation. Ernie Wright and C. Alex Young, "A Raster-oriented Method for Creating Eclipse Maps", The Astronomical Journal, volume 168, article 163, 13 pages, October 2024. Received 2024 April 23, accepted July 29, published September 19. DOI 10.3847/1538-3881/ad6b23. CC BY 4.0 1.
- The algorithm colours each map pixel total, partial or uneclipsed at each time step. Only pixels that cannot be classified trivially are submitted to a full limb test against an 18,000-element limb profile 1.
- The limb profile is built from SLDEM2015 (512 pixels per degree, 60 m at the equator) and the polar LDEM, in the Moon Mean Earth frame of DE421, on a 1737.4 km datum sphere. It is rebuilt every few minutes or whenever a libration angle changes by 0.01 degrees 1.
- The limb test is with the eclipse not total if . Distances are in apparent solar radii on the observer's image plane 1.
- The umbra is a polygon because each edge is an arc of a Sun image projected through one limb valley. At 18:00 UTC on 2017 August 21 the outline had 49 sides 1.
- A third eclipse type, broken annular, is mapped with the criterion 1.
- The paper does not state a value, a time step for 2024, a refraction model or a numerical comparison with Espenak or Jubier. Those come from the SVS pages, covered in svs-products-and-data.md and svs-vs-other-predictors.md.
The question. What does Ernie Wright's published method actually specify, with which datasets and constants, and how much of an implementation can a developer reconstruct from the paper alone?
The publication
The published method is Wright, E. and Young, C. A. 2024, "A Raster-oriented Method for Creating Eclipse Maps", The Astronomical Journal 168:163 (13 pages), published 2024 September 19, DOI 10.3847/1538-3881/ad6b23 1. Wright's affiliation is Universities Space Research Association and the Scientific Visualization Studio, Goddard Space Flight Center, Code 606.4. Young is Associate Director for Science, Heliophysics Science Division, Code 670. Wright's ORCID is 0000-0002-5970-5019. The article is open access under the Creative Commons Attribution 4.0 licence and carries an online animation as supplementary material 1.
Crossref confirms the DOI, the authorship and the issue date 2, and the paper is indexed as gold open access under a CC BY licence 1. NASA's September 2024 announcement 3 and the USRA newsroom release 4 both give the title and journal. No preprint exists: there is no arXiv version, and the ADS EPRINT link for bibcode 2024AJ....168..163W does not resolve.
Quotations below are from the publisher's PDF as captured by the Internet Archive on 2024 November 19; the article page itself is not retrievable without a browser session 1.
What the paper claims
The abstract states the thesis in one sentence: "Ignoring the terrain of both bodies introduces errors on the order of kilometers in the ground track of the umbra and seconds in the duration and contact times of totality" 1. The paper's own summary of its contribution is that it is "the first detailed description in the eclipse calculation literature" of numerical eclipse simulation, while explicitly not claiming to be the first implementation 1.
The background section credits prior limb-corrected maps to Michael Zeiler from 2012, "using eclipse software adapted for raster-oriented map calculations by Xavier Jubier and William Kramer", and dates the SVS work to December 2016, when maps and animations of the 2017 August 21 eclipse "for the first time accounted not only for the roughness of the lunar limb but also the terrain of the Earth" 1.
The raster approach
The method is defined against the Besselian elementsBesselian elementsThe time-dependent quantities , , , , , and the constants , that describe the Moon's shadow relative to the fundamental plane, from which any eclipse circumstance can be computed. tradition. Bessel's method projects the shadow onto the fundamental planefundamental planeThe plane through the Earth's centre perpendicular to the axis of the Moon's shadow. Its x axis lies in the equator pointing east, its y axis points north, and the shadow's cross-section on it is an exact circle. and characterises the eclipse by a few elements and their rates. The paper lists its simplifying assumptions: the Moon is a smooth sphere, its centre of mass coincides with its centre of figurecentre of figureThe centre of the Moon's mean limb figure. The ephemeris tabulates the centre of mass, which lies about 1.9 km away, mostly along the Earth-Moon line, so the sky-plane part is about 0.5 arcseconds, historically applied as +0.50 arcseconds in longitude and −0.25 arcseconds in latitude. A limb profile referenced to the centre of mass, as the LOLA and Kaguya grids are, supersedes the correction., and all observers lie on an ellipsoid 1.
The raster method instead finds "the presence or absence of the Moon's shadow at every pixel of a raster map over a large number of time steps". Each pixel is coloured "black for total, gray for partial, and white for no eclipse". Repeating over time gives an animation, and integrating the image sequence gives the path of totality 1. This is how the path limits and the central line are derived: they are not solved for as curves. They emerge as the boundary of the union of the umbra rasters, and the central line is the track of the shadow-axis intersection.
Each pixel is placed in three-dimensional space. Its geodetic longitude and latitude follow from the map projection. Its height above mean sea level is read from an Earth DEM. Height above the ellipsoid is obtained "by adding the geoid height". The paper states that most global DEMs "are now based on the WGS84 ellipsoid and EGM96 geoid" and that the DEM and the coordinate conversion must agree on both 1. The Earth DEM used for the NASA maps is not named in the paper. The SVS pages name SRTM 5.
The terrain effect is quantified as a shift of roughly , where is the elevation and is the Sun's altitude, in the direction of the Sun's azimuth 1. Figure 1 shows the umbra west of Idaho Falls on 2017 August 21 "perturbed and shifted roughly 1.5 km southeast by the elevation of the Earth's terrain". The 2016 SVS page puts the western-states shift at "as much as 3 kilometers" 5.
For pixels near the umbra edge the traditional local-circumstances calculation supplies three values: the distance between the centres of the lunar and solar discs in apparent solar radii, the relative sizes of the discs, and the position angleposition angleAn angle measured on the sky at the centre of a disk, from celestial north through east, used to locate a point on the limb of the Sun or Moon. Contact points and limb heights are indexed by it. of the Moon with respect to the Sun. "To test for totality, the Moon circle is replaced by a limb profile, an array of radii representing the actual shape of the limb. The eclipse is total for a given observer if the limb profile completely encompasses the Sun circle" 1. The paper stresses that this is a direct comparison on an image plane unique to each observer, whereas the Besselian test of distance from the shadow axis "relies crucially on the assumption that the cross section of the shadow is circular".
Creating the limb profile
Section 4 defines a lunar limb profilelunar limb profileThe height of the Moon's silhouette edge above a reference sphere, tabulated as a function of position angle around the disk for a given libration. It is what turns a smooth-disk eclipse prediction into one that knows where the valleys are. as "a one-dimensional array of radii at equally spaced angular intervals around the lunar limb". For an observer at distance from the Moon's centre the construction is 1:
- Convert each pixel of the lunar DEM to rectangular coordinates.
- Apply a rotation matrix encoding the topocentric librationlibrationThe slow apparent rocking of the Moon that changes which part of its surface faces an observer, expressed as a longitude and a latitude of the sub-observer point in selenographic coordinates. It ranges about plus or minus 8 degrees in each coordinate and sets which terrain lies on the limb. at the observer.
- Convert the transformed position's to polar .
- Replace with the angular radius .
- Convert to an index into the array .
- If is greater than , set .
The rotation in step 2 encodes the Moon mean-Earth/polar-axis (ME) frameMoon mean-Earth/polar-axis (ME) frameThe lunar body-fixed frame whose z axis is the mean rotation pole and whose x axis points to the mean sub-Earth point, as realised by a JPL ephemeris. LRO LOLA, SLDEM2015 and Kaguya LALT grids use the ME frame of DE421; the SPICE frame MOON_ME_DE440_ME421 reproduces it from DE440. longitude and latitude of the sub-observer point. After the rotation the centre of the disc as seen by the observer has coordinates , "where is the datum radius (1737.4 km for LRO DEMs) plus the elevation at that point". The arctangent in step 4 performs perspective foreshortening, and the paper notes that far-side points "can and do contribute to the limb". Index 0 is north and increases counterclockwise 1.
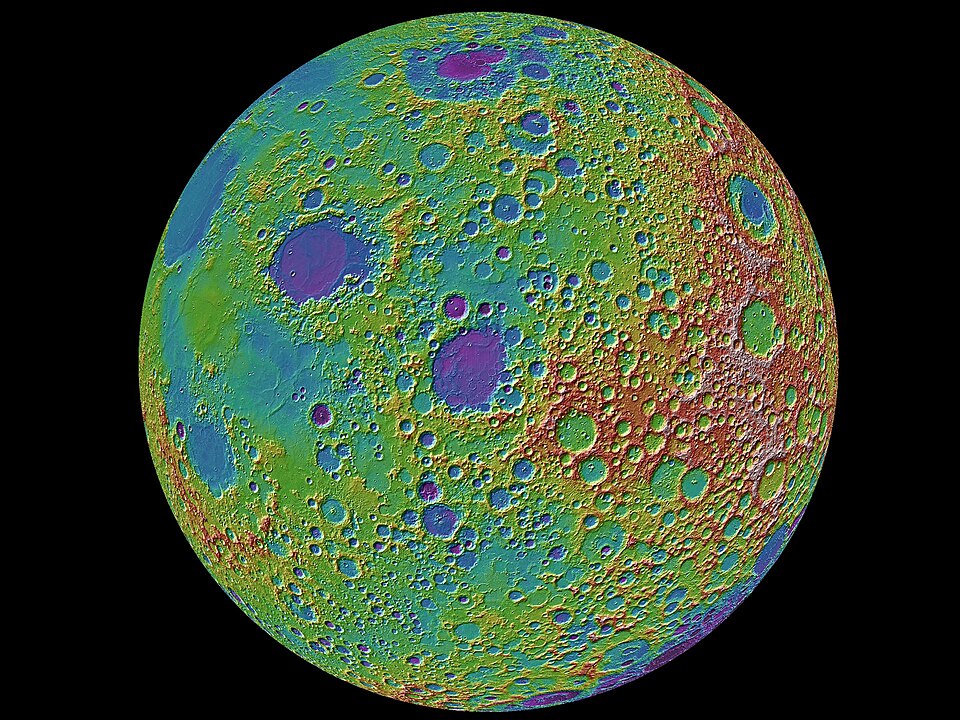
The datasets are named precisely. "As of this writing, the highest-quality lunar DEMs are SLDEM2015SLDEM2015A merged DEM of LOLA altimetry co-registered with SELENE Terrain Camera stereo, covering 60 S to 60 N at 512 pixels per degree, about 60 m at the equator, with a typical vertical accuracy of 3 to 4 m. (Barker et al. 2016), produced by combining data from the terrain camera (TC) on SELENE and the LRO laser altimeter (LOLA) on LRO, and the polar stereographic LDEMLDEMThe LOLA Lunar Digital Elevation Model series in the LRO GDR archive, gridded in equirectangular projection at 4, 16, 64, 128, 256, 512 and 1024 pixels per degree with heights in metres above a 1737.4 km sphere. from LOLA." SLDEM2015 covers 60 N to 60 S at 512 pixels per degree (60 m at the equator), with subsampled versions at 256 and 128 pixels per degree. The polar LDEMs fill the poles. Both are archived on the LRO node of the Planetary Data System, and the paper gives the link https://pds-geosciences.wustl.edu/missions/lro/lola.htm 1 6. Barker et al. describe SLDEM2015 as built from about 4.5 billion LOLA heights co-registered with 43,200 SELENE TC stereo DEMs, with typical vertical accuracy of 3 to 4 m 7.
The coordinate frame is stated: "LRO data are tied to the Moon Mean Earth (Moon ME) frame as realized by the Jet Propulsion Laboratory Developmental Ephemeris 421 (DE421)". The origin of longitude is the mean sub-Earth point, latitudes are planetocentric latitudeplanetocentric latitudeLatitude measured as the angle from the equatorial plane at the body's centre, as used for a spherical datum. Lunar DEMs referenced to the 1737.4 km sphere use it, so no ellipsoidal correction is needed when converting pixels to rectangular coordinates. because the DEM elevations are relative to a sphere, and the axes follow the modern convention with through longitude 0, north, east 1. The LRO project's coordinate document confirms the ME system, the 1737.4 km reference radius and the selection of DE421 8.
Resolution of the profile: "An L of 18,000 elements has a resolution of 0.02 degrees (roughly 600 m) and pairs well with DEMs of 240 m resolution." Too large an array "may include points not on the limb", too small "will miss small valleys" 1. The 240 m figure corresponds to the 128 pixel per degree subsample of SLDEM2015, not the full 512 pixel per degree product.
Cost control: creating a profile for every observer "is prohibitively expensive on modest computing hardware. A reasonable compromise is to create a profile for the observer on the shadow axis at time steps of a few minutes, or whenever a libration angle has changed by some small threshold, say 0.01 degrees." Only DEM points within 75 to 105 degrees east and west longitude in SLDEM and a 450 km wide swath through each polar LDEM are processed. Libration in latitude is always small during solar eclipses because they occur near the nodes 1.
The limb test
Section 5 lists the required quantities 1:
- , the number of elements in .
- , the observer to Moon distance at which was created.
- , the current observer's Moon distance.
- , the position angle of the lunar axisposition angle of the lunar axisThe angle, measured eastward from celestial north, of the Moon's rotation axis projected on the sky. Limb profiles are indexed from this axis, so it must be computed for the same time and observer as the libration. Written c in Wright and Young's limb test and stored as MoonC in the SVS umbra shapefiles., the position angle of the Moon's north pole axis.
- , the Sun to Moon apparent distance in solar radii.
- , the position angle of the Sun with respect to the Moon (the more usual angle of the Moon with respect to the Sun differs by ).
- , the apparent radius of the Sun in radians.
The test examines each :
- If , the eclipse is not total for the observer.
The Sun and Moon are placed in polar coordinates on the observer's image plane, celestial north up, units of apparent solar radius, Moon at the origin and Sun at . The scale corrects for the observer's distance and converts limb radii to solar radii. Step 4 is the polar distance formula with the square root omitted because the comparison is against 1 1. The axis angle and the profile are computed once per time step for the observer on the shadow axis, since differences between nearby observers are far smaller than the profile resolution.
Trivial exclusion defines the limb test zonelimb test zoneIn Wright and Young's raster method, the band of observers near the umbra edge for which totality cannot be decided from the mean lunar radius and every limb element must be tested against the solar disk in units of the apparent solar radius. 1:
- if , the observer is outside the umbra;
- if , the observer is inside the umbra.
Only observers satisfying neither condition need the full test. For annularity the sense reverses, failing on , with exclusions (inside the antumbraantumbraThe extension of the Moon's shadow cone beyond its vertex, within which the Moon appears smaller than the Sun. Where the antumbra reaches the ground the eclipse is annular.) and (outside). For eclipses with magnitude near 1 both tests are applied 1.
antialiasingantialiasingAssigning intermediate values to raster pixels that straddle a boundary, so that the edge is represented at sub-pixel precision rather than as a jagged step. In the SVS method the value comes from the sum of limb-test failures against a threshold set by the pixel area. is folded into the test. For failed elements the sum of is accumulated. If the sum is greater than 0 but less than a threshold , the pixel gets the intermediate value . "For = 18,000, setting works well, where is the pixel at the center of the shadow and is the area in square kilometers" 1. The stated purpose is to remove false precision and to help contour-tracing algorithms, which is how the vector shapefiles are extracted from the rasters.
Contact times at a site
The paper does not describe a separate local-circumstances routine. Second and third contact at a site follow from the same test applied to that site across time steps: totality begins at the first step where the limb profile encompasses the Sun and ends at the last. The cities JSON released with the 2024 map gives contact times to the second for towns in totality and appears to be produced this way 9. The time resolution of the released umbra polygons, 1 s for the high-resolution set, bounds the timing precision of anything derived from them 10.
The polygon explained
Section 6.2 uses the antialiasing pass to identify, for each edge pixel, "which is at the greatest internal distance from the solar limb". Plotting those elements "form[s] a minimal and coherent set of umbra polygon edges". Each limb point is then treated as a pinhole projecting an image of the Sun onto the Earth. "The locus of all such rays forms a double cone with its apex at the limb point." The Sun-image cone angle equals the shadow-cone angle and its axis deviates from the shadow axis by 2.4 arcseconds, the angle subtended by the Moon's radius at the Sun 1.
The shape follows: "The outer edge of the penumbra is defined by the outer edges of the Sun images. The umbra is the set of interior points not reached by any of these Sun images." At 18:00 UTC on 2017 August 21, 49 valleys contributed edges, and Figure 12 shows the 49 projected Sun images with the umbra as the hole in the middle. The edges are arcs, not straight lines. For the antumbra the focal points are peaks and the shape is the intersection of the Sun images 1. The 2024 SVS explainer page reproduces this account and the 49-valley count 11. Observers on an edge see the diamond ring from that valley, and observers at a vertex see a double diamond ring, a point the paper credits to Zeiler 12.
Broken annular
Section 6.3 introduces a "third type of central eclipse in which the shadow axis intersects the Earth's surface but the eclipse at that location is neither total nor annular". In the smooth-limb model the umbra and antumbra cones meet at a point, so a hybrid switches instantly. In reality there is a gap in which "a very thin ring of sunlight around the Moon is interrupted by high points on the lunar limb" 1.
The proposed criterion is that broken annularbroken annularA central eclipse phase, occurring in the gap between the umbra and the antumbra of a hybrid eclipse, in which the Moon is too large to fit inside the Sun and too small to cover it, so a thin ring of sunlight is interrupted by lunar peaks. Wright and Young map it where the range of limb radii exceeds the Sun to Moon separation. locations are the locus of points for which
valid only at locations that have already failed both the totality and annularity tests 1. Three examples are given. The 1894 April 6 eclipse "is never actually total, spending 2 hr as a broken annular over a span of nearly 5400 km". The 2005 April 8 hybrid has totality "flanked by more than 1300 and 730 km of broken annularity". The 2013 November 3 hybrid "has no true annular phase". Figure 13 maps the 2005 path assuming = 696,000 km and simulates Baily's beads at 1 s intervals from 21:55:26 to 21:55:32 UTC as seen from 94.02587 W, 6.45677 N. The SVS release of that simulation runs in real time from 21:55:20.5 to 21:55:35.5 UTC 13.
The solar radius
Section 6.4 is the paper's statement on the constant that matters most near the limits. "Nearly all eclipse calculations use a de facto standard value of the solar radius first published more than a century ago and expressed as either 959.63 arcseconds at 1 au (Auwers 1891) or 696,000 km (Yatskiv 1978)." The IAU 2015 nominal unit is 695,700 km, equivalent to 959.22 arcseconds, and the paper quotes Prsa et al. that nominal values "should be understood as conversion factors only" 1.
The paper argues the nominal solar radiusnominal solar radiusThe IAU 2015 conversion constant of exactly 695,700 km (959.22 arcseconds at 1 au), chosen to match the helioseismic photosphere. It is a unit for expressing stellar radii, not a measured limb, and is too small for eclipse geometry. "does not provide the solar radius required for accurate eclipse prediction, which defines totality as the complete extinction of the photosphere". It lists recent eclipse solar radiuseclipse solar radiusThe solar radius that, used in an accurate eclipse model with a lunar limb profile, reproduces observed second and third contacts. Flash-spectrum and photometer measurements put it at 959.95 to 960.0 arcseconds at 1 au, about 0.3 arcseconds larger than the canonical value. determinations: 959.99 plus or minus 0.06 arcseconds (Lamy et al. 2015), 959.95 plus or minus 0.05 (Quaglia et al. 2021), 959.98 (Jubier et al. 2021) and 960.01 (Guhl 2023) 1. Quaglia et al. obtained their value from flash-spectrum video at the southern limit of the 2017 path and report no significant wavelength dependence 14. Guhl's value comes from Baily's beads photometry at the northern limit of the 2023 April 20 hybrid, a correction of plus 0.38 arcseconds to 959.63, giving 960.01 plus or minus 0.12 arcseconds 15.
The sensitivity statement is quotable: "a discrepancy of 1 s in duration, for example, corresponds to an error as small as 20 km (0.03 arcseconds) in solar radius" for points very close to the path limits 1. The paper recounts the March 2024 episode in which John Irwin's map, "based on a solar radius of 959.95 arcseconds", shifted the northern limit "to the southeast by several city blocks compared to maps calculated with the conventional radius", and dozens of journalists asked whether NASA would revise its map 1. It did not. See svs-vs-other-predictors.md.
The paper does not say which solar radius the 2024 NASA map used. The SVS product pages for 2017 state 696,000 km 16, and the paper's Figure 13 uses the same value, so the working assumption is that all SVS maps to date use 696,000 km, which is 959.63 to 959.645 arcseconds depending on the au conversion used.
Appendix A, the software stack
The appendix is the only public description of the implementation. "The code that generated the NASA maps relies primarily on SPICE." It prints C-language calls 1:
vsub_c( obs, mpos, pos );          /* translate to Moon-centered */
mxv_c( mmat, pos, pos );           /* rotate from ICRF to Moon ME */
reclat_c( pos, dist, lam, bet );   /* to spherical coords */
which return the observer's Moon distance and the Moon ME sub-observer longitude and latitude, that is, the topocentric libration. The Moon's ICRF position comes from spkezp_c(ID_MOON, t, "ICRF", "lt+s", ID_EARTH, mpos, <) with light time and stellar aberration, from the kernel de440.bsp. The rotation to the body-fixed frame is pxform_c("ICRF", "MOON_ME_DE440_ME421", t, mmat) using moon_pa_de440_200625.bpc and moon_de440_200625.tf. That frame kernel is the 2020 release, and NAIF's current file for the same frame is moon_de440_250416.tf. The frame name records that "the origin of selenographic coordinates for LRO data products is the mean sub-Earth point found by the DE421 calculation, not that of DE440" 1.
The observer is placed with georec_c(lon, lat, h, earth_r, flattening, obs), where is ellipsoid height, and rotated to the ICRF with pxform_c("ITRF93", "ICRF", t, omat) using earth_latest_high_prec.bpc. The paper warns that "SPICE Earth orientation kernels are less reliable or nonexistent for times in the future or before 1962" and gives the SOFA equivalent, iauC2t06a(tta, ttb, uta, utb, xp, yp, omat_inv) followed by a transpose 1. This is where ΔTΔTThe difference TT − UT1 between uniform Terrestrial Time, in which the elements are computed, and Universal Time, which follows the Earth's irregular rotation. About 69 s in 2024. It converts the hour angle μ to a geographic longitude, is known only by prediction for future eclipses, and is the largest error source for historical ones. enters: it is implicit in the Earth orientation parameters (EOP)Earth orientation parameters (EOP)The measured quantities UT1 − UTC, polar motion (x, y), length of day and celestial pole offsets, published by the IERS, that relate the Earth-fixed frame to the celestial frame. They cannot be known in advance and are the only prediction inputs that must be re-fetched before an eclipse. kernel rather than a stated number. The SVS 2017 pages state the value that resulted, = 68.917 s, and describe the kernel as "earth_070425_370426_predict.bpc (ΔT corrected)" 16.
The ephemeris is therefore DE440 at the time of writing the paper, while every SVS product page from 2015 through 2025 lists DE421 as its dataset 10 17. Both cannot be true for the same run. The likely reading is that the maps were made with DE421 and the paper's appendix was written against the current kernel set. The difference between DE421 and DE440 in the Moon's geocentric position in 2024 is far below the 600 m limb-profile resolution, so the choice has no visible effect on the products.
Nothing in the paper or on any SVS page mentions Maya, RenderMan or any commercial renderer for the eclipse calculation itself. The 2017 shapefile page says only that "the map was rendered in animation software, but maps are more typically created using GIS tools" 18. The 2015 page says the Besselian method "was adapted to the routines available in NAIF's SPICE software library" 19.
What the paper does not say
- No value for 2024. It is embedded in the Earth orientation kernel.
- No time step for the 2024 map. The released umbra_hi shapefile is at 1 s and umbra_lo at 10 s 10.
- No refraction model. The March 2025 map page says the sunrise and sunset lines "are based on an idealized model" and that "the apparent positions of the Sun and Moon relative to the horizon are affected by local terrain and atmospheric refraction" 17.
- No Earth DEM named. SVS pages credit SRTM 5.
- No numerical comparison with Espenak or Jubier. The only comparison is the qualitative "several city blocks" against Irwin's map.
- No stated uncertainty in kilometres for its own path edges. NASA's public statement during the 2024 dispute acknowledged "a tiny but real uncertainty about the size of the Sun" and that "uncertainty in the Earth's rotation can also affect eclipse predictions on this level" 20.
- No code release. See the searches described in svs-products-and-data.md.
Prior art the paper builds on
The reference list is the best map of the field's genealogy. On the limb: Kopal 1965 and Weimer 1979 for early catalogues, then the Watts chartsWatts chartsThe lunar limb profiles published by Chester Burleigh Watts in 1963 from machine tracings of about 700 photographs covering the range of librations, used for eclipse and occultation timing until laser altimetry replaced them. of 1963, which "remained in use for eclipse and occultation timing for half a century" despite flaws documented by Scott 1988, before being supplanted by SELENE and LRO altimetry 1 21 22 23 24. On applying limb profiles: Herald 1983 in the Journal of the BAA, "a purely graphical construction that involves plotting solar limb curves on transparencies" over exaggerated limb plots like Duncombe's 1973 USNO circular, sliding along the position angle to find the limb-corrected contacts 25 26. The paper says software authors "have automated this method and adapted it to newer lunar terrain data, but the details of their implementations remain largely undocumented". It points to Herald's Occult documentation and to Wang et al. 2021 for details of limb-profile use 27 28.
On elevation: Williams 1971 for adapting Bessel by replacing 1 Earth radius with the elevated radius, Lewis 1940 for USNO central-line maps at ionospheric altitudes, Fiala et al. 1987 for interpolating between tabulated heights, and Schneider 2004 for aircraft intercepts 29 30. On the canonical formulation: Bessel 1829 and 1830, Chauvenet 1863, both editions of the Explanatory Supplement, Meeus 1989 and Montenbruck and Pfleger 2000 31. On ephemerides and frames: Folkner et al. 2009 for DE421, Park et al. 2021 for DE440, the LRO coordinate-system memo of 2008 32 33 8.
Two names a reader of the eclipse-radius literature would expect are absent. Sigismondi is not cited. Dunham is not cited by name, though IOTA appears through Herald and through Guhl's paper in the Journal for Occultation Astronomy. The Kaguya (SELENE) work enters only as Araki et al. 2009 and through SLDEM2015's use of the SELENE terrain camera.
Sources compared
| Source | What it uniquely provides |
|---|---|
| Wright and Young 2024 1 | The algorithm: limb-profile construction, limb test, antialiasing threshold, broken-annular criterion, SPICE calls. Read in full from the PDF. |
| SVS 4515 and 4516 16 | The constants table: radii, ellipsoid, geoid, ephemeris, EOP kernel, = 68.917 s for 2017. |
| SVS 4314 19 | The smooth-model baseline and its "About Accuracy" paragraph, including = 0.2723993 and the 0.5 km centre-of-mass offset. |
| SVS 4517 5 | The first published explanation of the polygon, with the 3 km terrain shift and the point-cloud rotation description. |
| SVS 5366 11 | The pinhole explanation with the 49-valley count, released with the paper. |
| NASA press article 3 | Wright's own plain-language framing and the "potato" quote. |
| Quaglia et al. 2021 14 | The 959.95 arcsecond value the paper contrasts against. |
What a developer should do
Read the paper's sections 4 and 5 first. They are complete enough to implement. Then:
- Download SLDEM2015 at 128 or 256 pixels per degree and the polar LDEMs from the PDS LOLA node 6. Read
dsmap.catanddsmap_polar.catfor the pixel-to-longitude mapping. Use the 1737.4 km datum and planetocentric latitude. - Use SPICE with
de440.bsp,moon_pa_de440_200625.bpc, the frame kernelmoon_de440_250416.tf, which is NAIF's current release of themoon_de440_200625.tfthe paper prints, and the frameMOON_ME_DE440_ME421, exactly as printed in Appendix A, so that the DEM and the frame agree 1. - Build with 18,000 elements for the shadow-axis observer, rebuilt when libration moves by 0.01 degrees. Store and .
- Implement the limb test as written, with the trivial exclusions, and the antialiasing with .
- Convert SRTM or a successor DEM's orthometric heights to ellipsoid heights with EGM96 before calling
georec_c. - Choose and state the solar radius. The paper gives you the sensitivity: 0.03 arcseconds is 1 s of duration at the limits.
- Validate against the released umbra_hi polygons for 2024 34, which are the paper's own output.
What this changes
For the pipeline design this replaces the "limb correction as a post-processing step on Besselian contacts" model with a per-pixel test. The path limits, central line, duration contours and obscuration contours are all derived products of a raster stack, which means one code path produces every map layer. It also establishes that the limb profile, not the ephemeris, sets the resolution floor at about 600 m, and that the solar radius, not the limb, is the dominant unresolved uncertainty at the limits.
Open questions
- The 2024 run's and ephemeris. Obtain the SVS API JSON for page 5123 or an author statement to settle whether DE421 or DE440 and which EOP kernel produced the 2024 shapefiles.
- The Earth DEM resolution used. SRTM exists at 1 and 3 arcseconds. The paper's 240 m lunar pairing suggests a coarse Earth grid, but the map pixel size for 2024 is unstated. The insolation dataset is at 360/8192 degrees per pixel 35, which may be the shadow-raster grid.
- A test of the broken-annular criterion against observation. The 1986 October 3 and 2023 April 20 eclipses have observers. Compare the criterion's locus with the reported bead sequences.
- The unpublished code. Ask the author whether the C code can be released. Until then the shapefiles are the only ground truth.
References
- 1peer-reviewed Wright, E. and Young, C. A. 2024, A Raster-oriented Method for Creating Eclipse Maps, AJ 168, 163 The paper. Read in full from the Wayback capture of the IOP PDF dated 2024-11-19 (iopscience.iop.org/article/10.3847/1538-3881/ad6b23/pdf), extracted with pdftotext. CC BY 4.0. Sections 4 and 5 give the limb-profile construction and the limb test; Appendix A gives the SPICE calls.
- 2primary Crossref record for DOI 10.3847/1538-3881/ad6b23 Confirms authors Wright and Young, container The Astronomical Journal, issued 2024-09-19. A Crossref author query for Ernie Wright plus eclipse returned no other eclipse paper by him.
- 3primary NASA Science, NASA Develops Process to Create Very Accurate Eclipse Maps (2024-09-19) Press article on the paper with Wright's quotes ("why does it look like a potato"). Read via fetch tool.
- 4company USRA newsroom, A New Process Brings Precision to Eclipse Mapping (2024-09-26) Employer press release naming the paper and journal. Direct fetch returned 403; read from Wayback capture 2024-09-27.
- 5primary NASA SVS 4517, Umbra Shapes (2016, updated 2024) The explainer page: polygon edges as limb valleys, 3 km terrain shift, point-cloud limb profile from SLDEM2015 and LOLA, SRTM elevations, Watts history. Read in full from Wayback capture 2024-04-24.
- 6primary PDS Geosciences Node, LRO LOLA data page Lists EDR, RDR, GDR, SHADR and SLDEM products and archive directories; the link the paper gives for the DEMs. Read via fetch tool.
- 7peer-reviewed Barker, M. K., Mazarico, E., Neumann, G. A. et al. 2016, A New Lunar Digital Elevation Model from LOLA and SELENE Terrain Camera, Icarus 273, 346 SLDEM2015: 512 pixels per degree within 60 degrees of the equator, 3 to 4 m vertical accuracy, 4.5 billion LOLA heights plus 43,200 TC DEMs. Abstract read via Semantic Scholar.
- 8primary LRO Project 2008, A Standardized Lunar Coordinate System for the Lunar Reconnaissance Orbiter Defines the Mean Earth/Polar Axis system for PDS products, the 1737.4 km reference radius and DE421 as the selected ephemeris. PDF downloaded and read.
- 9primary NASA SVS, cities-eclipse-2024.json Downloaded from Wayback capture 2025-02-12: 32,174 objects with STATE, NAME, LAT, LON, ECLIPSE (5 or 6 UTC times); contacts to 1 s, partial phases to 10 s.
- 10primary NASA SVS 5123, The 2024 Total Solar Eclipse (2023, updated 2024-04-07) 2024 map page with the same method statement and shapefile list; download path /vis/a000000/a005100/a005123/2024eclipse_shapefiles.zip. Read from Wayback capture 2024-05-06.
- 11primary NASA SVS 5366, Solar Eclipse Shadow Shape Explained (2024) Pinhole-projection explainer released with the paper; 49 valleys for 2017; datasets LOLA DEM, DE421, SLDEM2015. Read in full from Wayback capture 2025-04-20.
- 12company Zeiler, M. 2024, Finding the Double Diamond Ring, GreatAmericanEclipse.com Umbra polygon as convex hull of chords, Zeiler's 2011 to 2012 maps with Jubier, and the 2017 comparison with Wright showing "good agreement despite a different computational process". Read via fetch tool.
- 13primary NASA SVS 5365, Broken Annular Baily's Beads Simulation (2024) Real-time bead simulation for 2005-04-08 hybrid from 94.02587 W, 6.45677 N, 21:55:20.5 to 21:55:35.5 UTC; links the AJ paper. Read from Wayback capture 2026-08-28.
- 14peer-reviewed Quaglia, L., Irwin, J., Emmanouilidis, K. and Pessi, A. 2021, Estimation of the Eclipse Solar Radius by Flash Spectrum Video Analysis, ApJS 256, 36 959.95 plus or minus 0.05 arcsec from 2017 southern-limit flash-spectrum video, no wavelength dependence. Abstract read at arXiv:2107.09416; full text not read.
- 15trade Guhl, K. 2023, ATSE2023 solar radius from Baily's beads, Journal for Occultation Astronomy 2023-4, p. 12 Correction plus 0.38 arcsec to 959.63 giving 960.01 plus or minus 0.12 arcsec from the 2023-04-20 northern limit; same issue has Quaglia et al. photodiode results 959.90 to 960.02. PDF downloaded and read.
- 16primary NASA SVS 4515, 2017 Path of Totality (2016) First limb- and terrain-corrected product. Constants table with WGS84, EGM96, 1737.4 km, 696,000 km (959.645 arcsec), DE421, EOP kernel, Delta T 68.917 s. Read from Wayback capture 2026-08-28.
- 17primary NASA SVS 5510, Map of the March 29, 2025 Partial Solar Eclipse (2025) Global partial map; gamma 1.0405 credited to Espenak; umbra misses by about 215 km; same refraction caveat. Read from Wayback capture 2026-08-20.
- 18primary NASA SVS 4518, 2017 Total Solar Eclipse Map and Shapefiles (2016) Describes eclipse2017_shapefiles.zip and eclipse2017_shapefiles_1s.zip (6000 umbra shapes at 1 s, 100 m precision, path at 250 m). States WGS84 lat-long projection. Read from Wayback capture 2026-08-28.
- 19primary NASA SVS 4314, 2017 Total Solar Eclipse in the U.S. (2015) Smooth-model animation with the About Accuracy constants table (k = 0.2723993, 959.634 arcsec, DE421, Delta UTC 68.184 s). Read from Wayback capture 2026-08-28.
- 20trade Wattles, J. 2024, New calculations have raised concerns popular eclipse maps might be off, CNN (2024-04-05) NASA statement by Karen Fox on the solar radius and path width, Guinan's "couple thousand feet". Direct fetch returned 451; read from Wayback capture 2025-07-24.
- 21primary Watts, C. B. 1963, The Marginal Zone of the Moon, Astronomical Papers of the American Ephemeris 17, 1 The 1963 limb charts from about 700 photographs over 17 years, used for half a century. Not read; cited via the paper and SVS 4517.
- 22peer-reviewed Scott, D. K. 1988, Errors in the Watts limb charts, AJ 95, 1567 Documents flaws in the Watts profiles. Not read; cited via the paper.
- 23peer-reviewed Araki, H., Tazawa, S., Noda, H. et al. 2009, Lunar Global Shape and Polar Topography Derived from Kaguya-LALT Laser Altimetry, Science 323, 897 The SELENE/Kaguya altimetry that with LRO supplanted Watts. Not read; cited via the paper.
- 24peer-reviewed Smith, D. E., Zuber, M. T., Neumann, G. A. et al. 2017, Summary of the results from the Lunar Orbiter Laser Altimeter after seven years in lunar orbit, Icarus 283, 70 LOLA mission summary cited by the paper. Not read.
- 25peer-reviewed Herald, D. 1983, Correcting predictions of solar eclipse contact times for the effects of lunar limb irregularities, JBAA 93, 241 The graphical transparency method for limb-corrected contacts, as described by Wright and Young. Not read; ADS returned 405 to the fetch tool.
- 26primary Duncombe, J. S. 1973, Lunar Limb Profiles for Solar Eclipses, USNO Circular 141 Exaggerated limb plots used in Herald's graphical method. Not read; cited via the paper.
- 27company Herald, D., Occult software Pointed to by Wright and Young for details of limb-profile use in occultation software. Not read.
- 28peer-reviewed Wang, Y.-B., Yan, J.-G., Ye, M. et al. 2021, Research in Astronomy and Astrophysics 21, 011 Pointed to by Wright and Young for lunar limb-profile details. Not read.
- 29primary Williams, W. J. 1971, Prediction and analysis of solar eclipse circumstances, AFCRL-71-0049 Adapting Bessel to observer elevation by replacing the unit Earth radius. Not read; cited via the paper.
- 30primary Fiala, A., Bangert, J. A. and Harris, W. T. 1987, Total Solar Eclipse of 17-18 March 1988, USNO Circular 172 Suggests interpolating between calculations at two or three heights. Not read; cited via the paper.
- 31peer-reviewed Urban, S. E. and Seidelmann, P. K. (eds.) 2012, Explanatory Supplement to the Astronomical Almanac, 3rd edition The standard modern statement of Bessel's method, cited by the paper and by SVS 4314. Not read here.
- 32primary Folkner, W. M., Williams, J. G. and Boggs, D. H. 2009, The Planetary and Lunar Ephemeris DE 421, IPN Progress Report 42-178 The ephemeris linked from every SVS eclipse page. Not read.
- 33peer-reviewed Park, R. S., Folkner, W. M., Williams, J. G. and Boggs, D. H. 2021, The JPL Planetary and Lunar Ephemerides DE440 and DE441, AJ 161, 105 The ephemeris named in the paper's Appendix A (de440.bsp). Not read.
- 34primary NASA SVS, 2024eclipse_shapefiles.zip (78.6 MB) Downloaded from Wayback capture 2025-02-12 and parsed: umbra_hi 6741 records at 1 s 17:56:00 to 19:48:20 UTC with 12 attributes; umbra_lo 1181 at 10 s; center, duration, ppath, ppath01, upath_hi, upath_lo; all .prj GCS_WGS_1984.
- 35primary NASA SVS 5248, Insolation during the 2024 Eclipse (2024) Releases obscuration rasters at 10 s from 15:42:10 to 20:52:20 UTC at 360/8192 degrees per pixel; the only stated raster grid. Read from Wayback capture 2026-08-22.